With the success of large language models (LLMs) like GPT-4 and Gemini, researchers are now incorporating visual understanding into these models, leading to the rise of multi-modal large language models (MLLMs) like LLaVA, SPHINX, and Qwen-VL. These models extract visual tokens from input images, yet they often struggle with efficiently processing intricate visual details, unlike humans who dynamically focus on specific image regions.
While MLLMs such as CLIP, EVA2-CLIP, and InternVL process images with a fixed-grain approach, mimicking human-like reasoning requires identifying key image regions and zooming in to adjust the context dynamically. Currently, MLLMs rely heavily on text data, lacking the capability for multi-turn, dynamic visual input handling and interpretable reasoning. This challenge is further compounded by the lack of intermediate visual chain-of-thought (CoT) supervision in existing visual question-answering (VQA) datasets and the reliance on static image context inputs in popular MLLM pipelines.
To address these challenges, we introduce a 438k visual CoT dataset, where each visual question-answer pair includes a bounding box highlighting the key image region essential for answering the question. This dataset contains 98k question-answer pairs with detailed reasoning steps to instruct MLLMs logically. Our proposed pipeline enhances visual CoT reasoning by focusing on key regions and providing step-by-step interpretability.
There is a shortage of multimodal datasets for training multi-modal large language models (MLLMs) that need to identify specific regions in images to improve response performance. Datasets with grounding bbox annotations can help MLLMs output interpretable attention areas and enhance performance. To address this gap, we curate a visual CoT dataset, focusing on identifying critical image regions. Each data sample includes a question, answer, and visual bounding box across five domains, with some samples providing extra detailed reasoning steps.
Our dataset integrates diverse data, including text/doc, fine-grained understanding, charts, general VQA, and relation reasoning, to support detailed visual and textual analysis:
These modalities ensure that the dataset not only addresses current gaps but also enhances MLLM versatility across diverse scenarios.
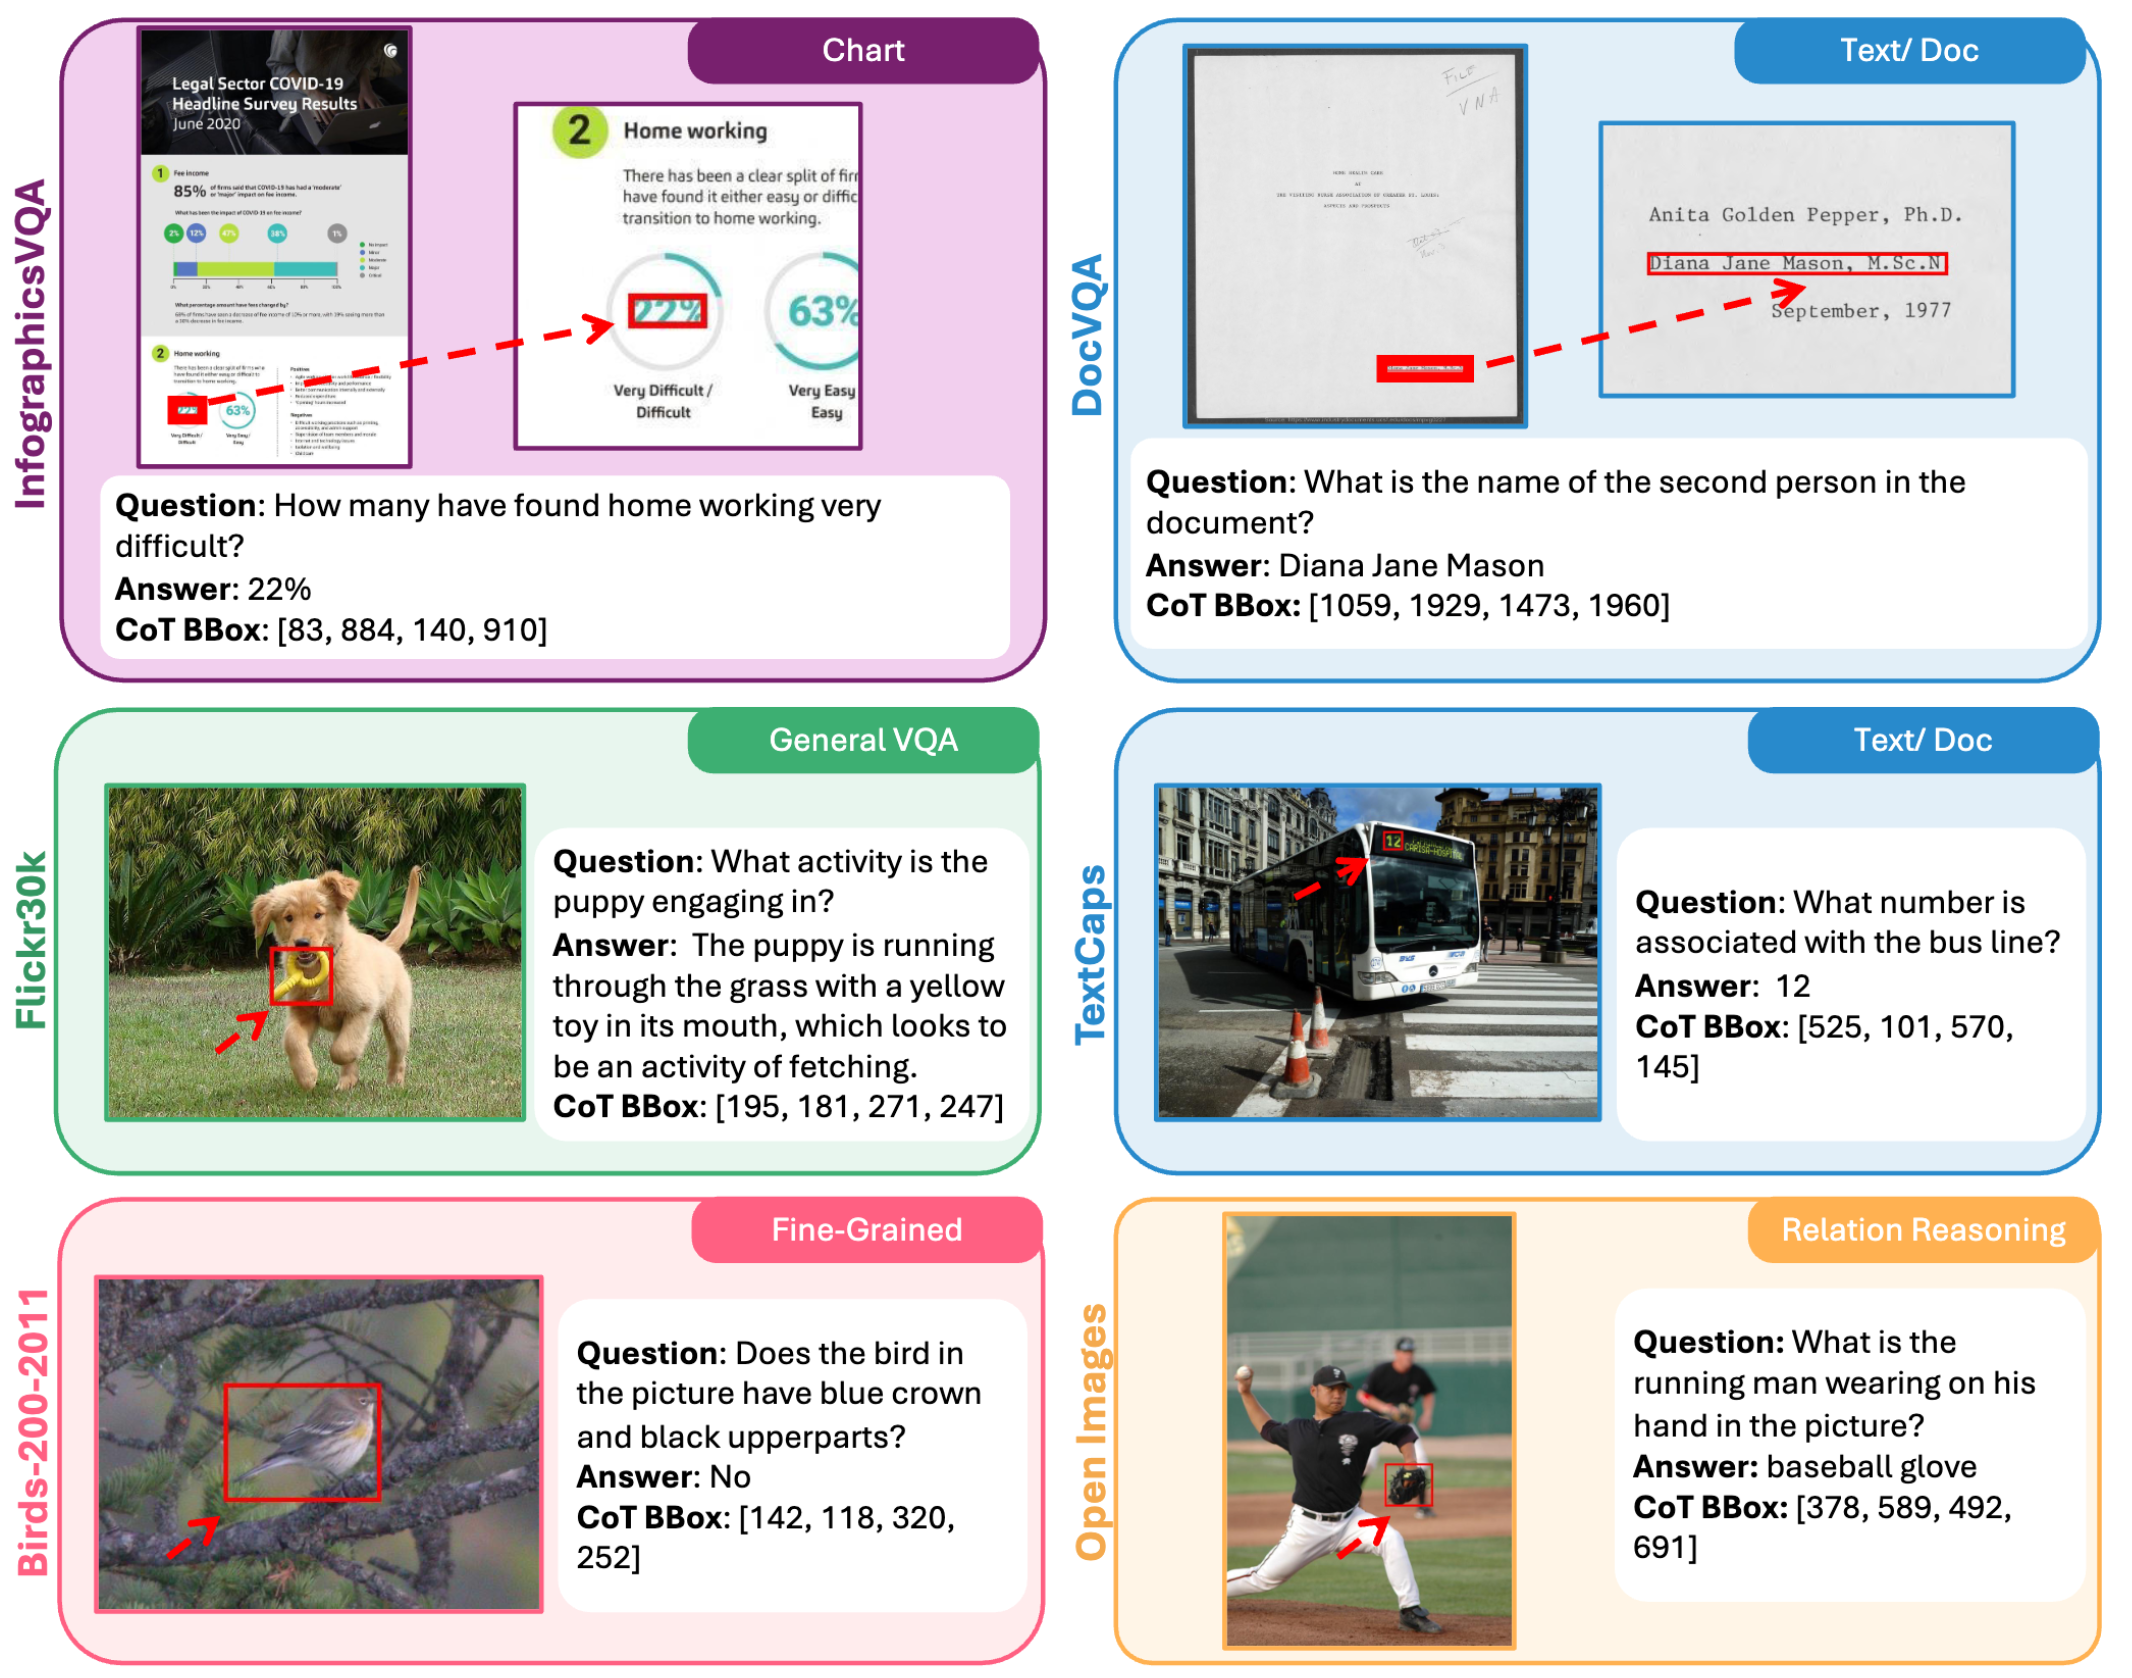
The visual CoT dataset covers five domains. The red bounding boxes highlight critical image regions that provide essential information for answering the questions.
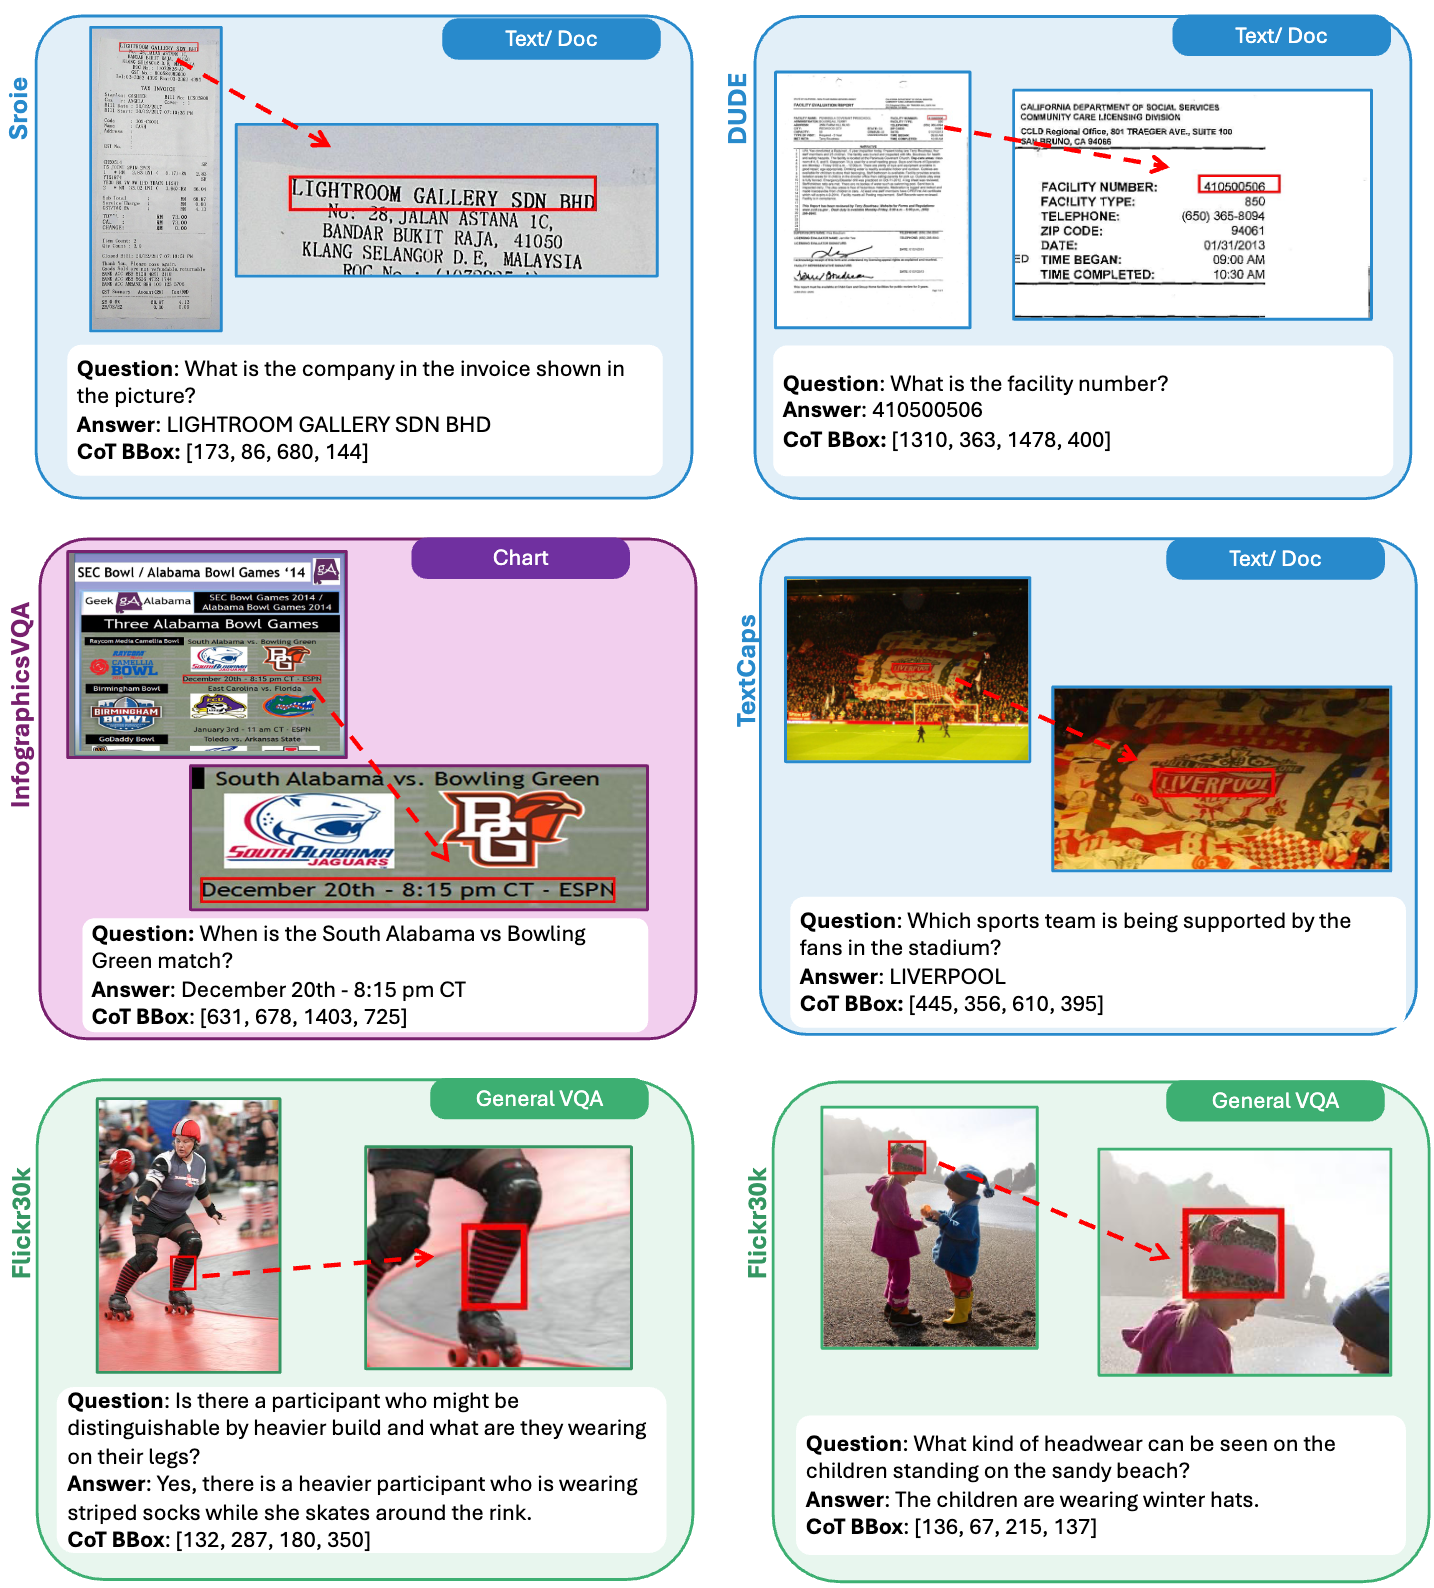
The visual CoT dataset covers five domains. The red bounding boxes highlight critical image regions that provide essential information for answering the questions.
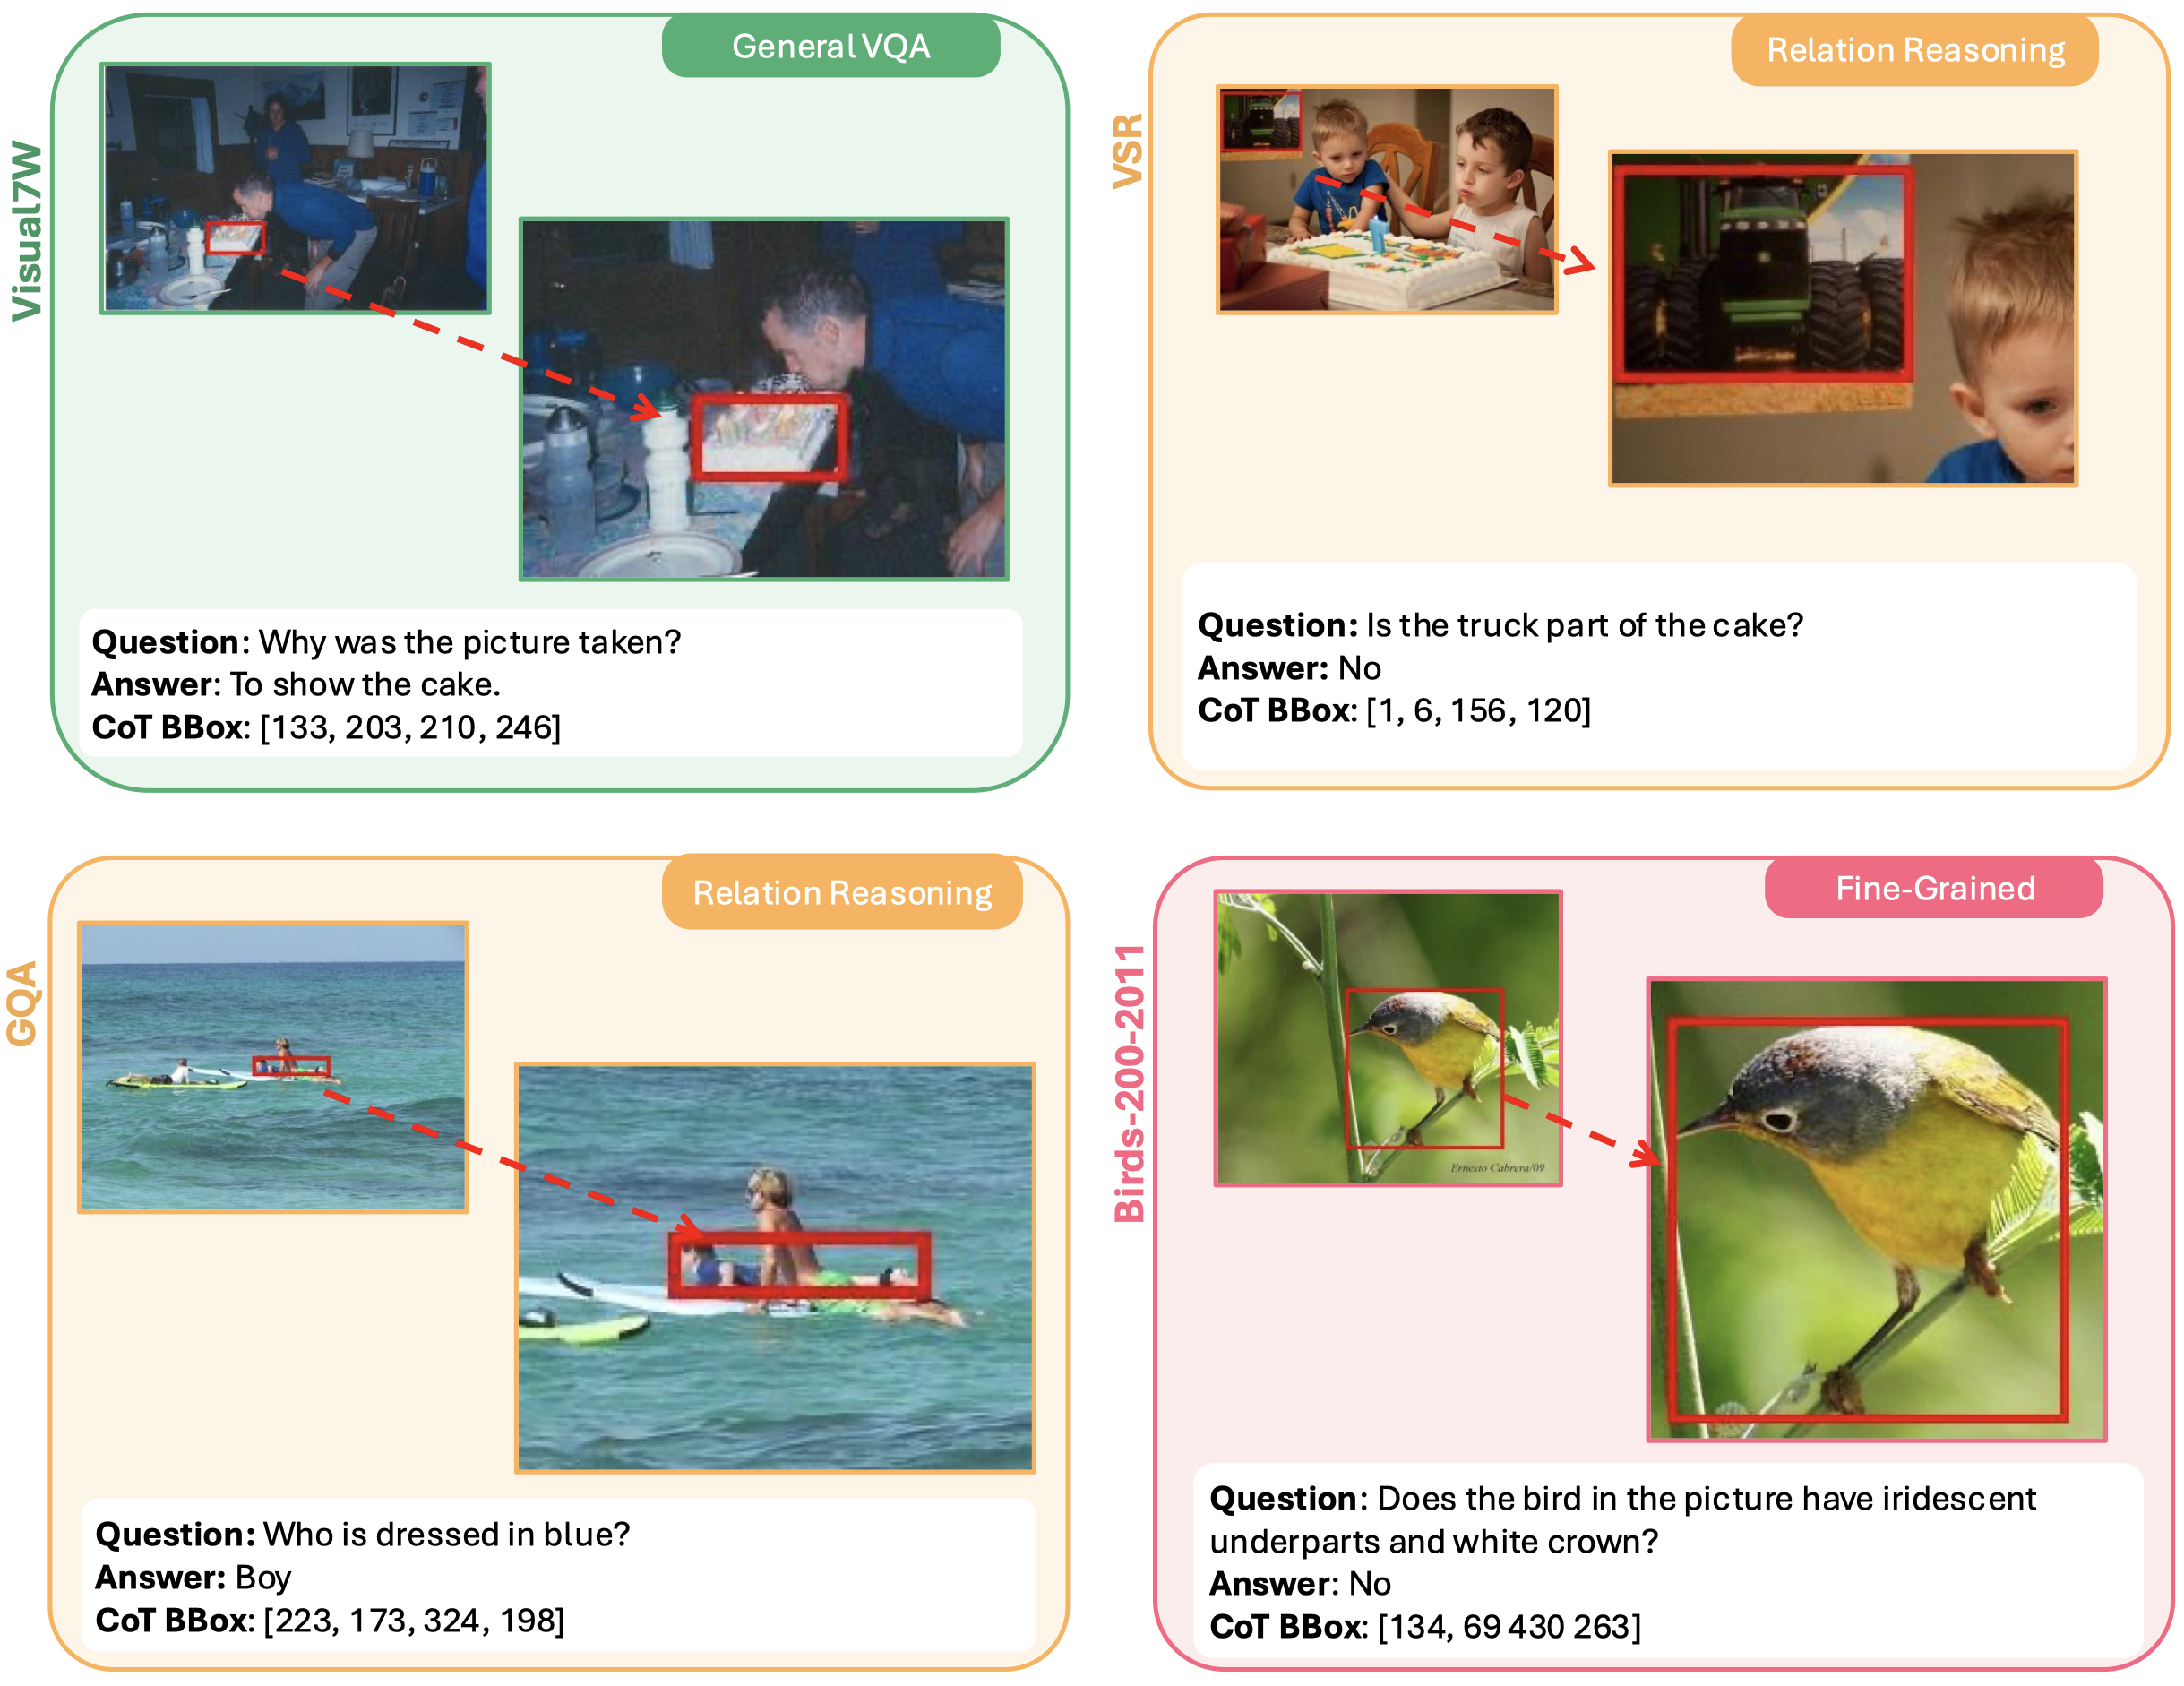
The visual CoT dataset covers five domains. The red bounding boxes highlight critical image regions that provide essential information for answering the questions.
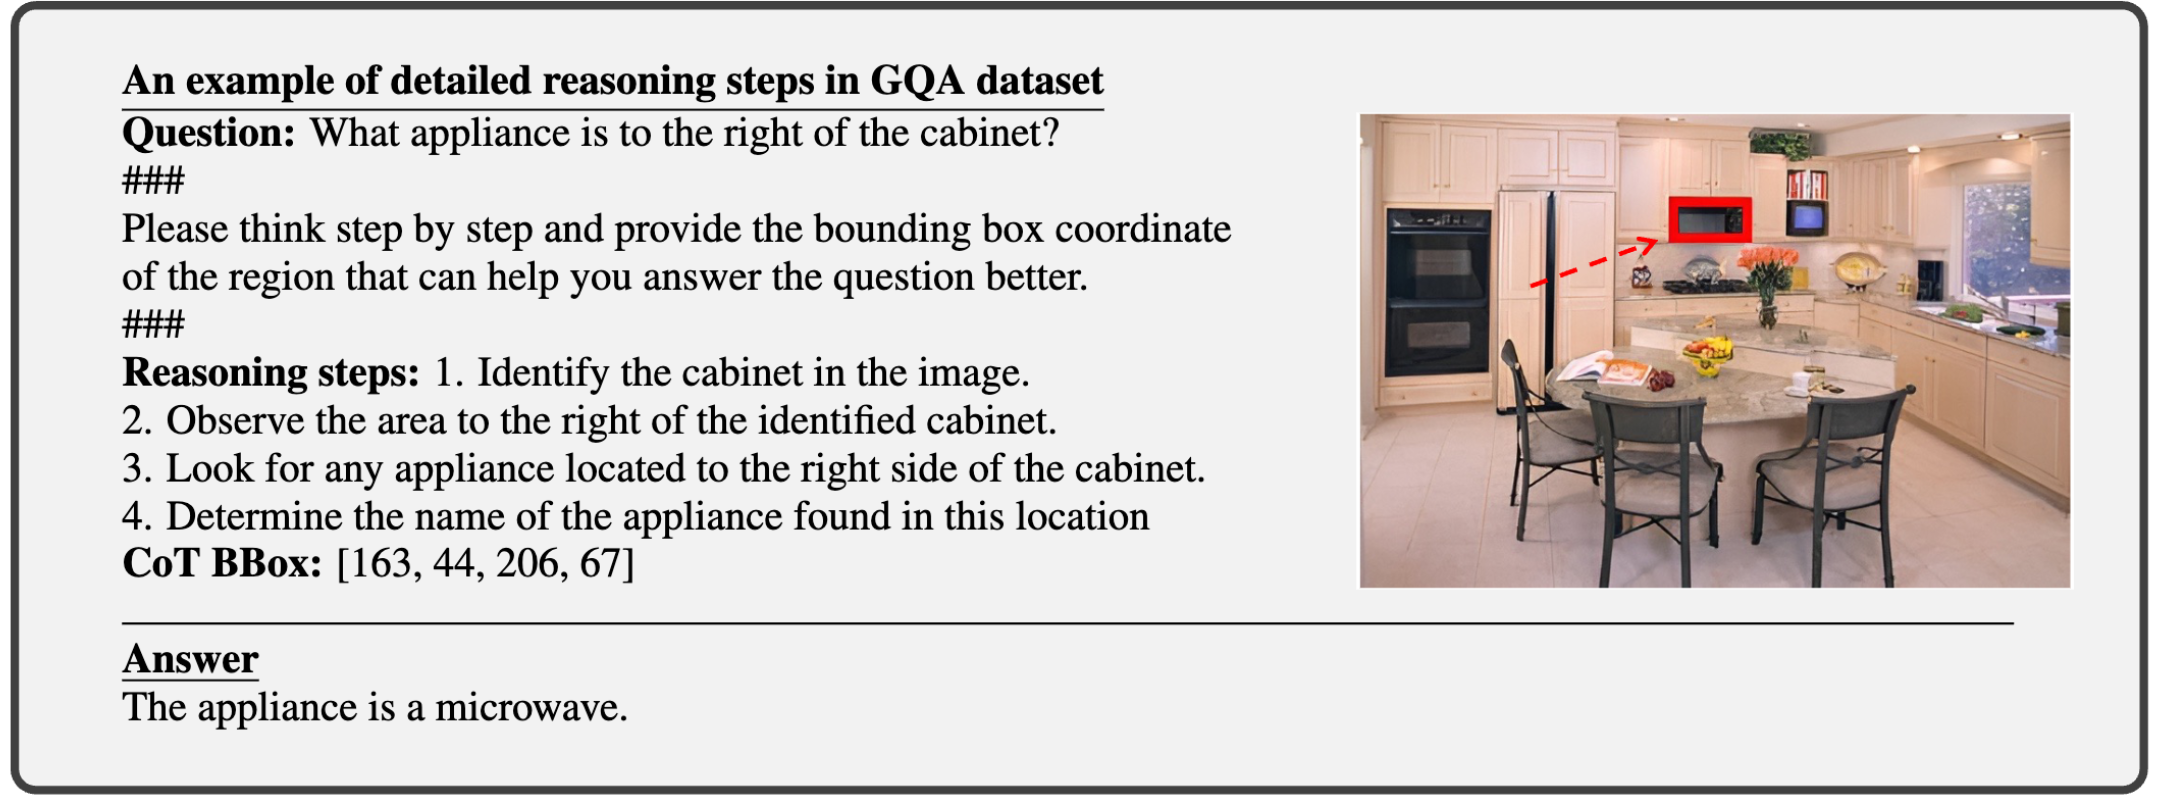
One data example with detailed reasoning steps, of which we have collected about 98k of this type. The red bounding box shows the important image region for answering the question.
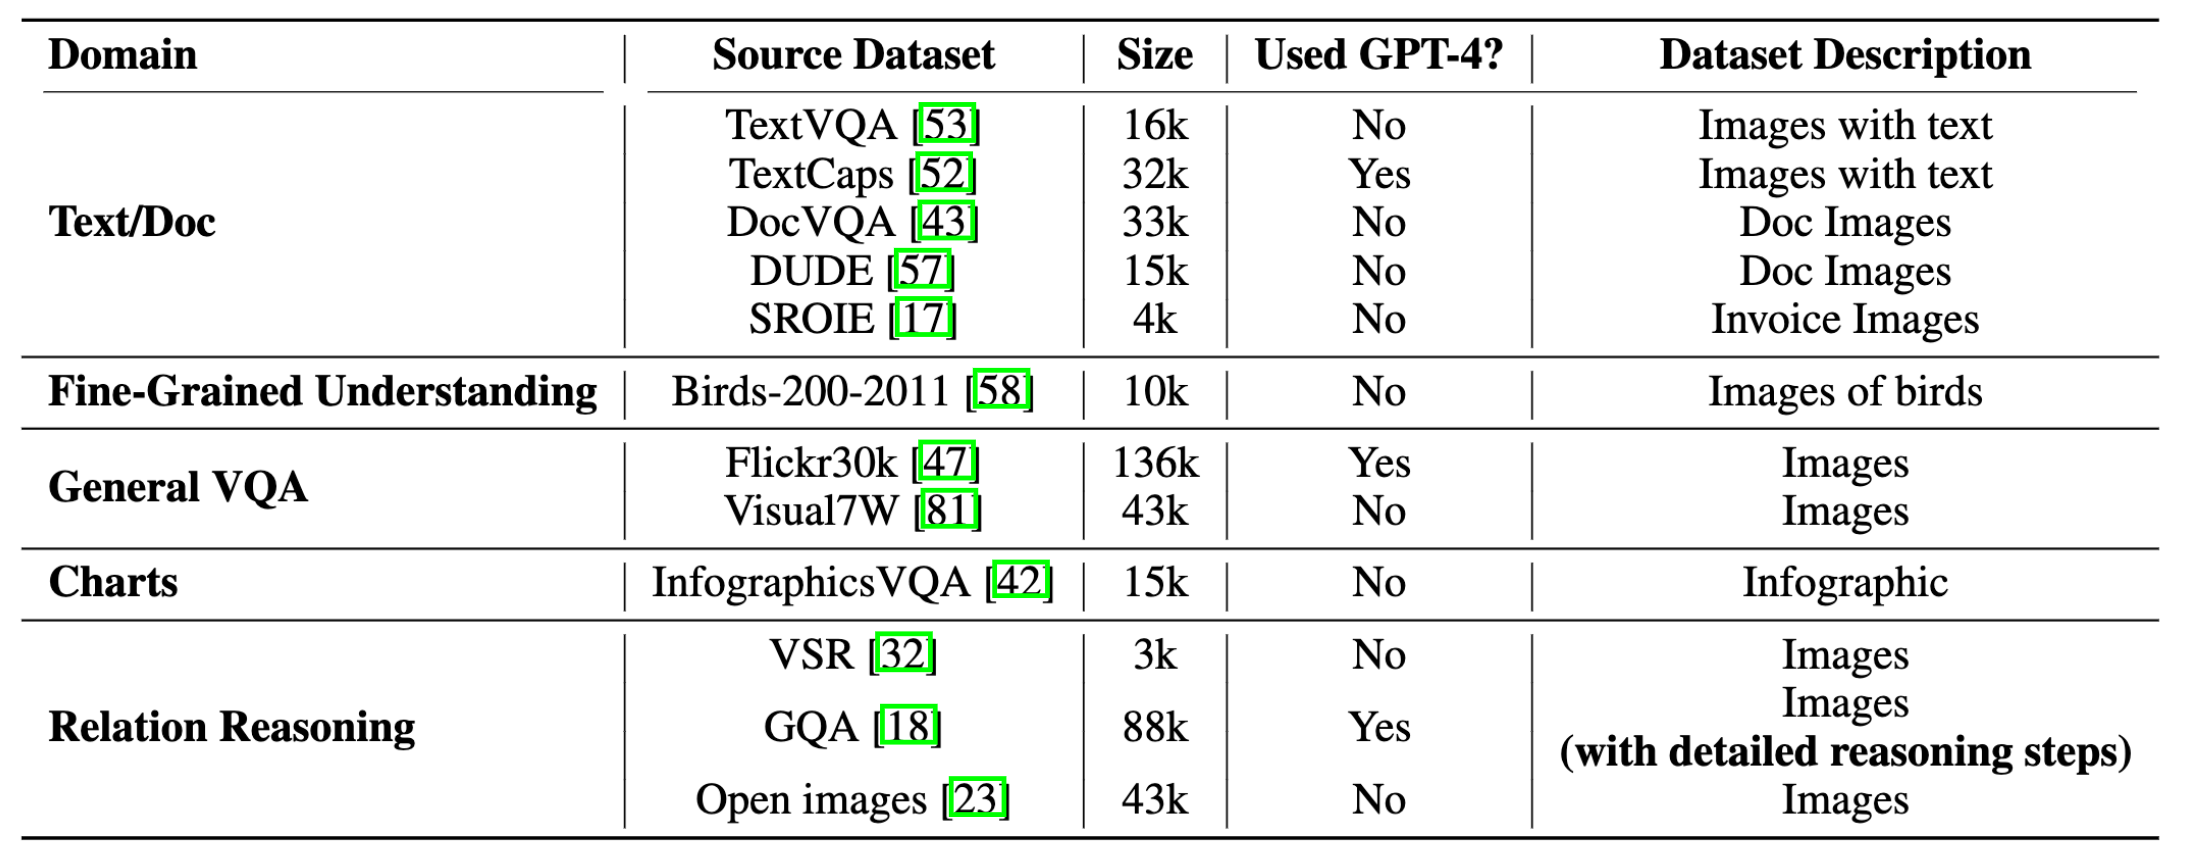
The overview of the visual CoT dataset. The dataset spans five distinct domains and includes various source datasets, ensuring a broad representation of visual data styles.
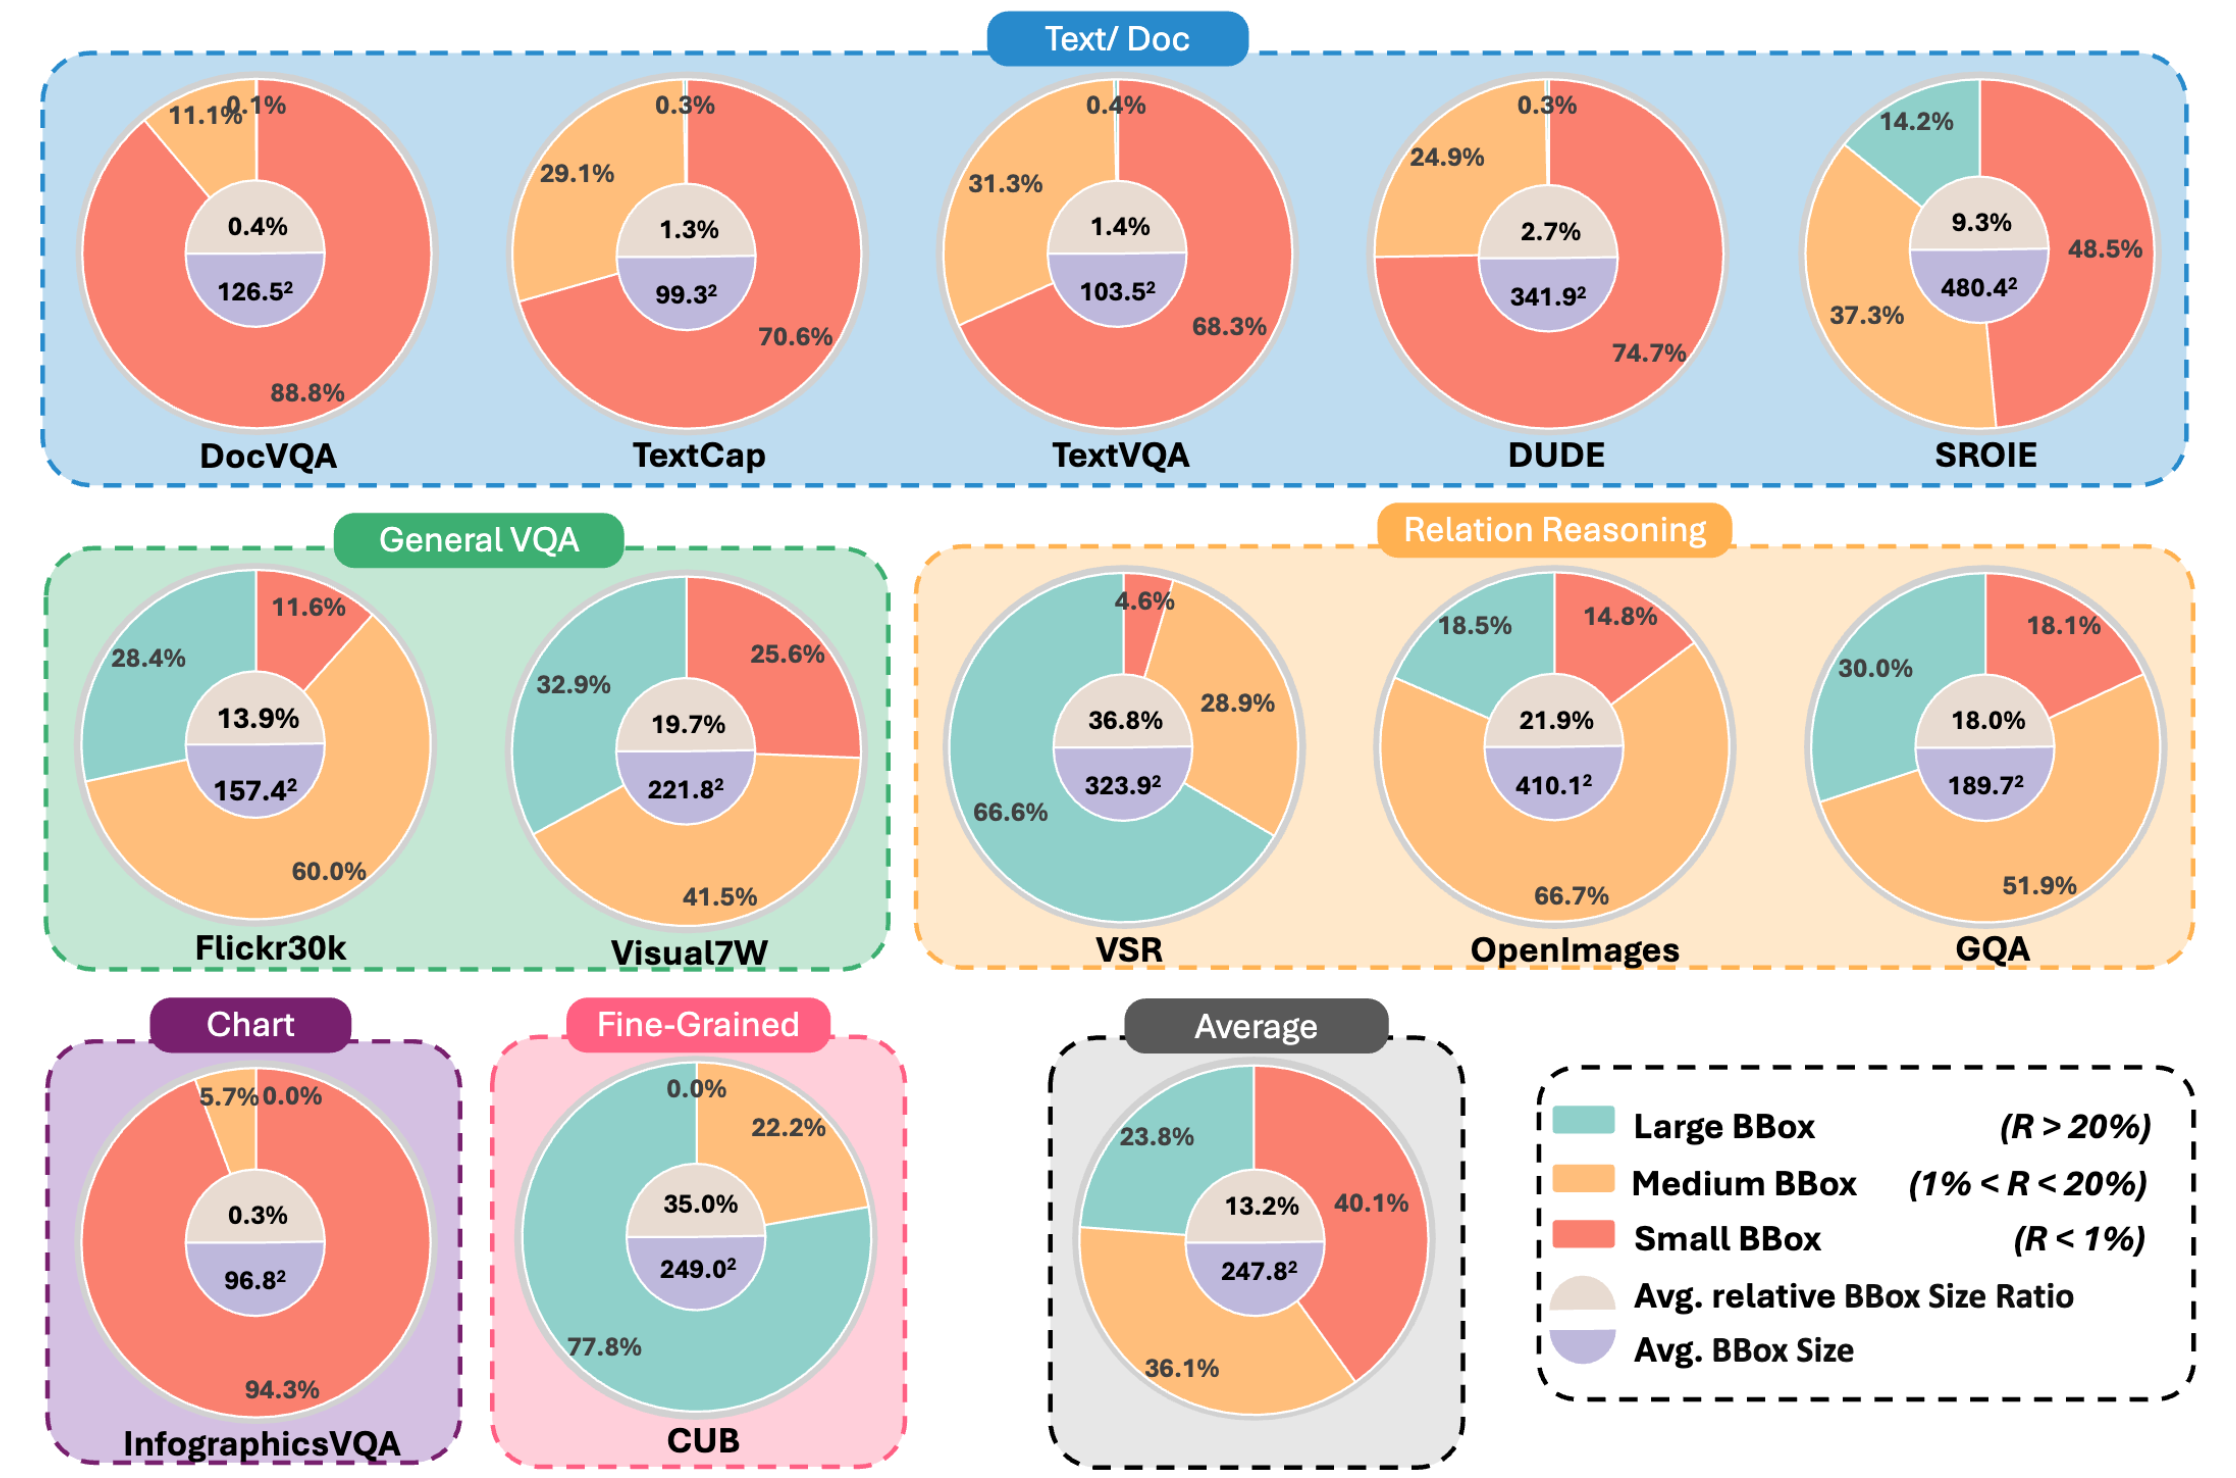
Statistics of the proposed visual CoT dataset. We visualize the CoT bbox distribution, average bbox size, and average relative size of bbox area R for each source dataset.
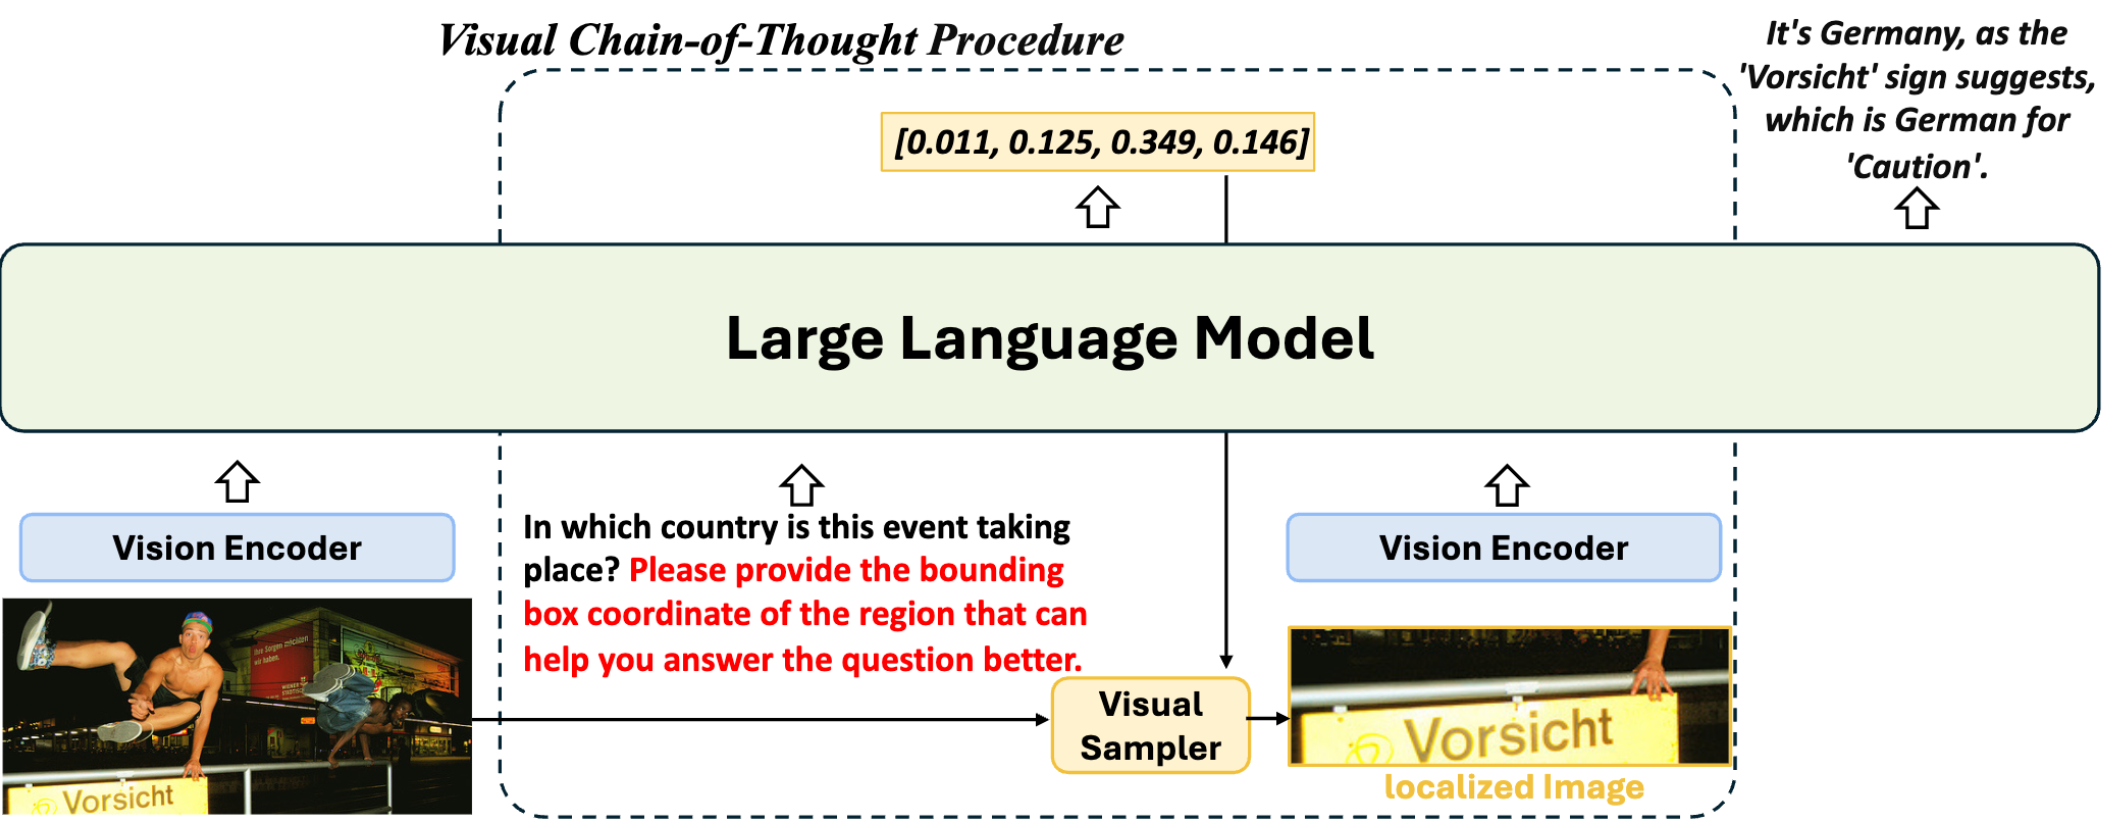
We introduce a visual CoT MLLM framework, VisCoT, which uses standard models without modifications, serving as a baseline for enhancing MLLMs with visual CoT capabilities.
To train the MLLM, a CoT prompt is added: "Please provide the bounding box coordinate of the region that can help you answer the question better." VisCoT identifies the region and generates the bounding box. The ground truth bounding box is used to extract a localized image (X1) from the original (X0). Visual tokens {H0, H1} from both images are then integrated for more accurate answers.
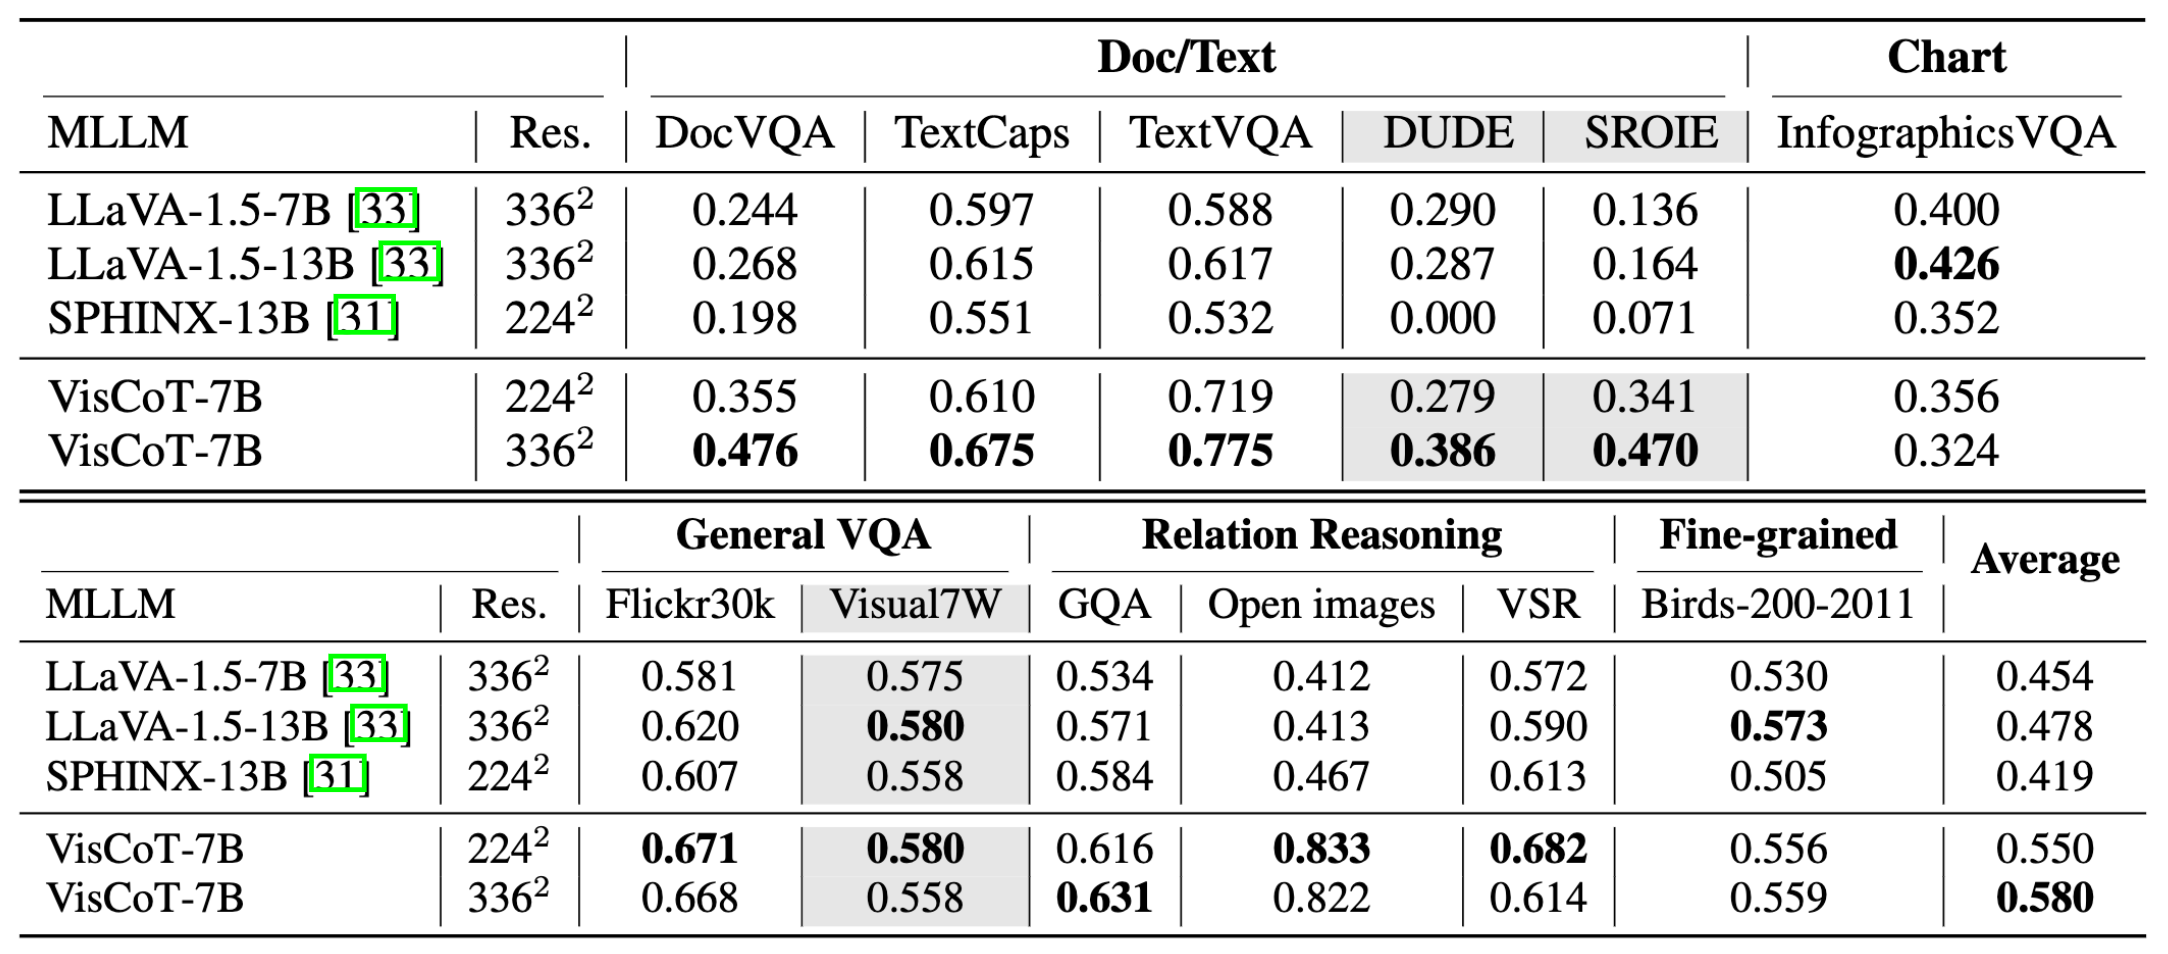
We provide an overview of our visual CoT benchmark, focusing on scenarios where the MLLM must concentrate on specific image regions. We use 12 source datasets and follow official training/evaluation splits when available, otherwise, we create random splits. The test sets of SROIE, DUDE, and Visual7W are used to evaluate zero-shot visual CoT capabilities. Following prior MLLM studies [28, 40], we use ChatGPT [45] to assign a numerical score between 0 and 1, where higher scores indicate better prediction accuracy.
We evaluate VisCoT across various multi-modal tasks to assess its visual understanding ability. The Table shows improvements through the visual CoT benchmark. Compared to LLaVA-1.5 on the visual CoT benchmark, our model shows significant improvements, especially in doc/text tasks and high-resolution images. For instance, in the SROIE dataset, which extracts key information from receipts, our model achieves 8× performance over the standard pipeline without the CoT process. This demonstrates the visual CoT pipeline’s efficacy in enhancing both visual and textual interpretation.
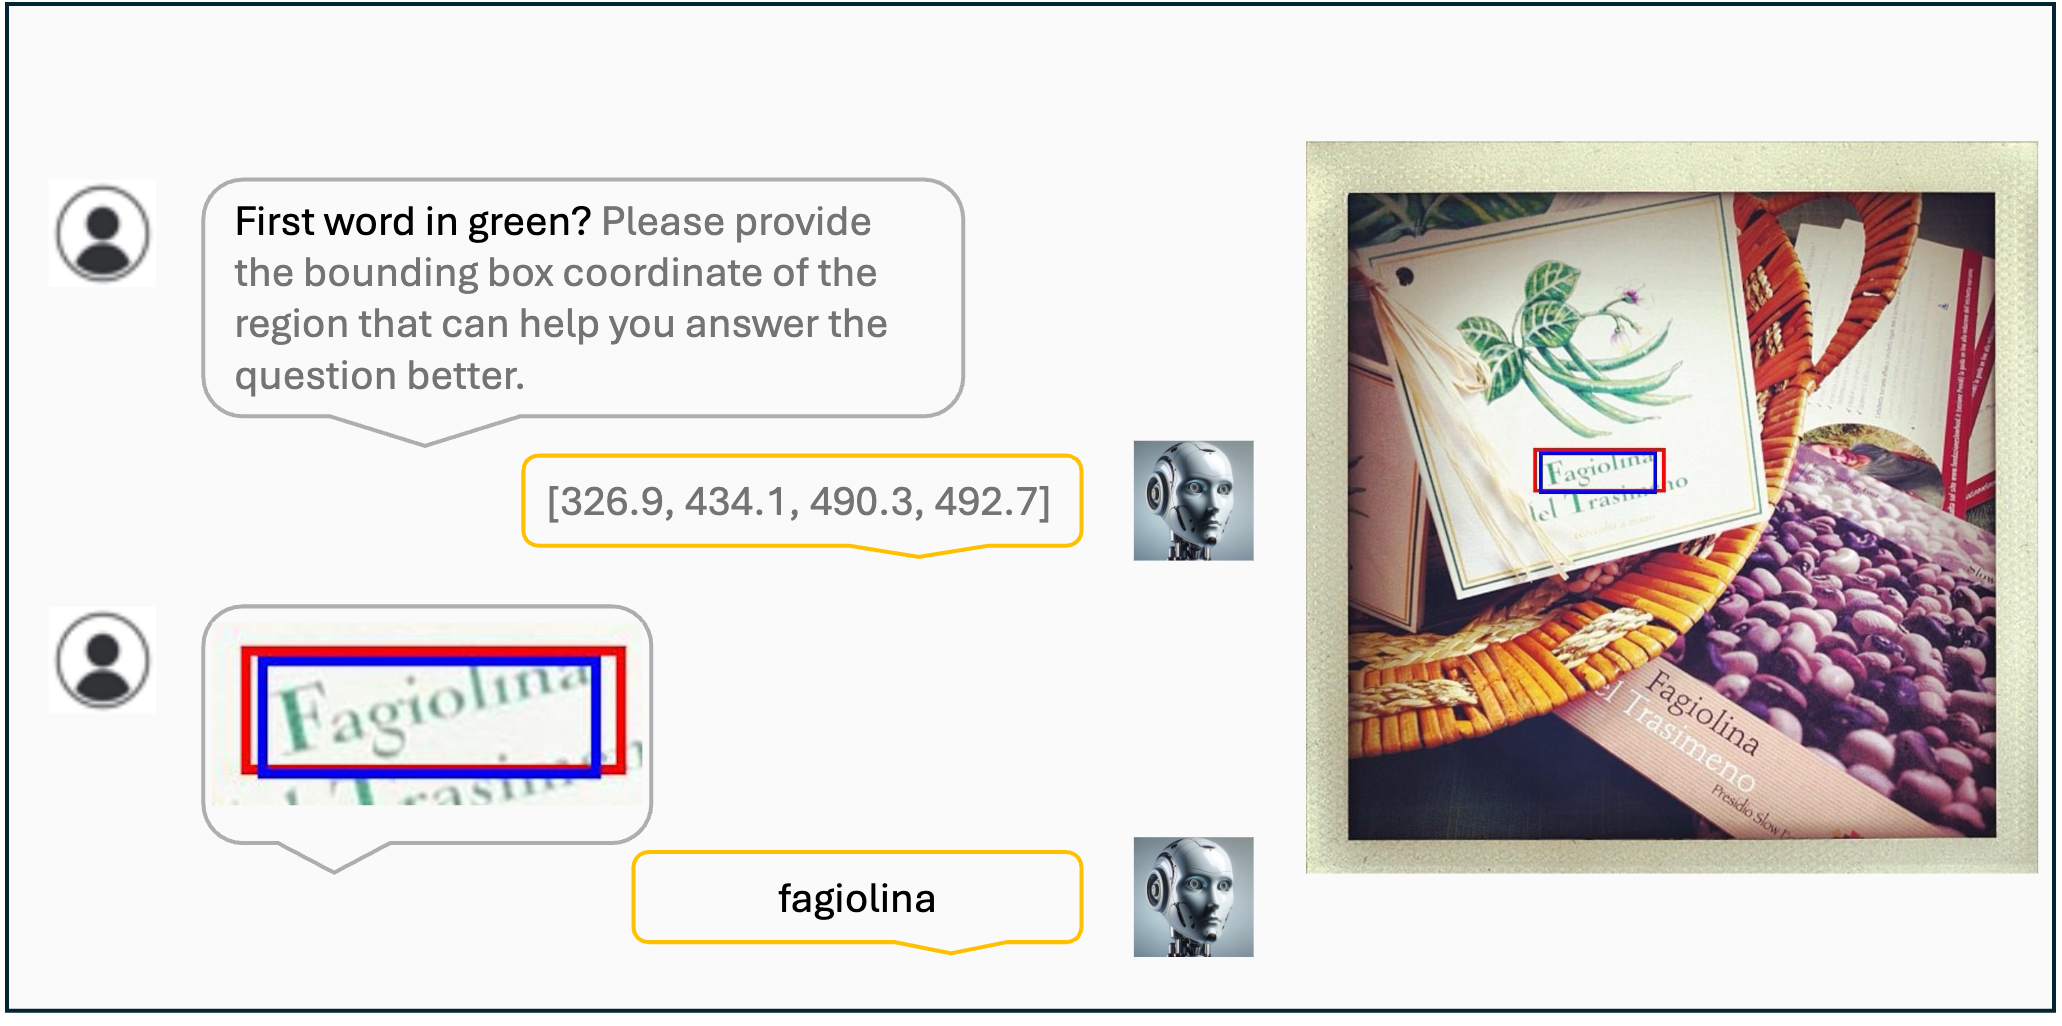
Visualization results of the VisCoT. Model-generated bounding boxes are shown in red, while ground truth (GT) bounding boxes are in blue.
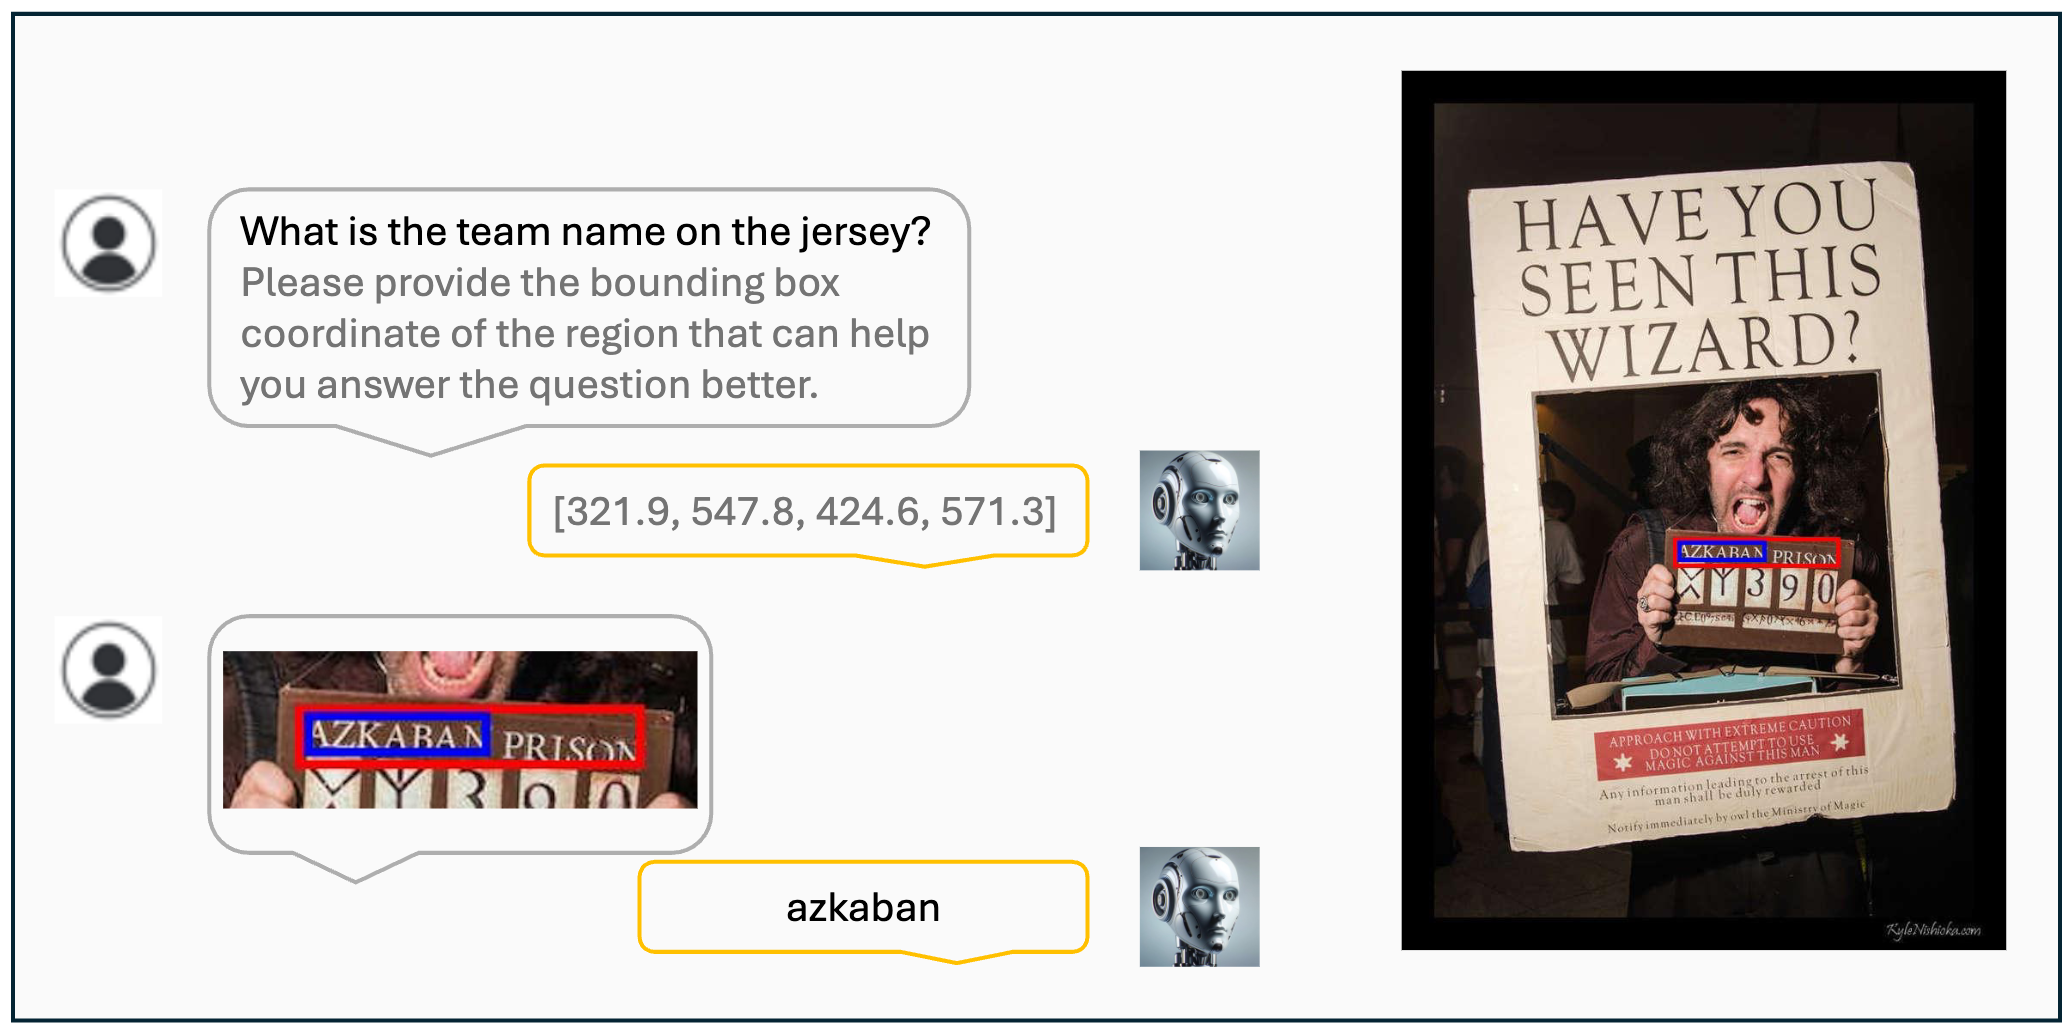
Visualization results of the VisCoT. Model-generated bounding boxes are shown in red, while ground truth (GT) bounding boxes are in blue.
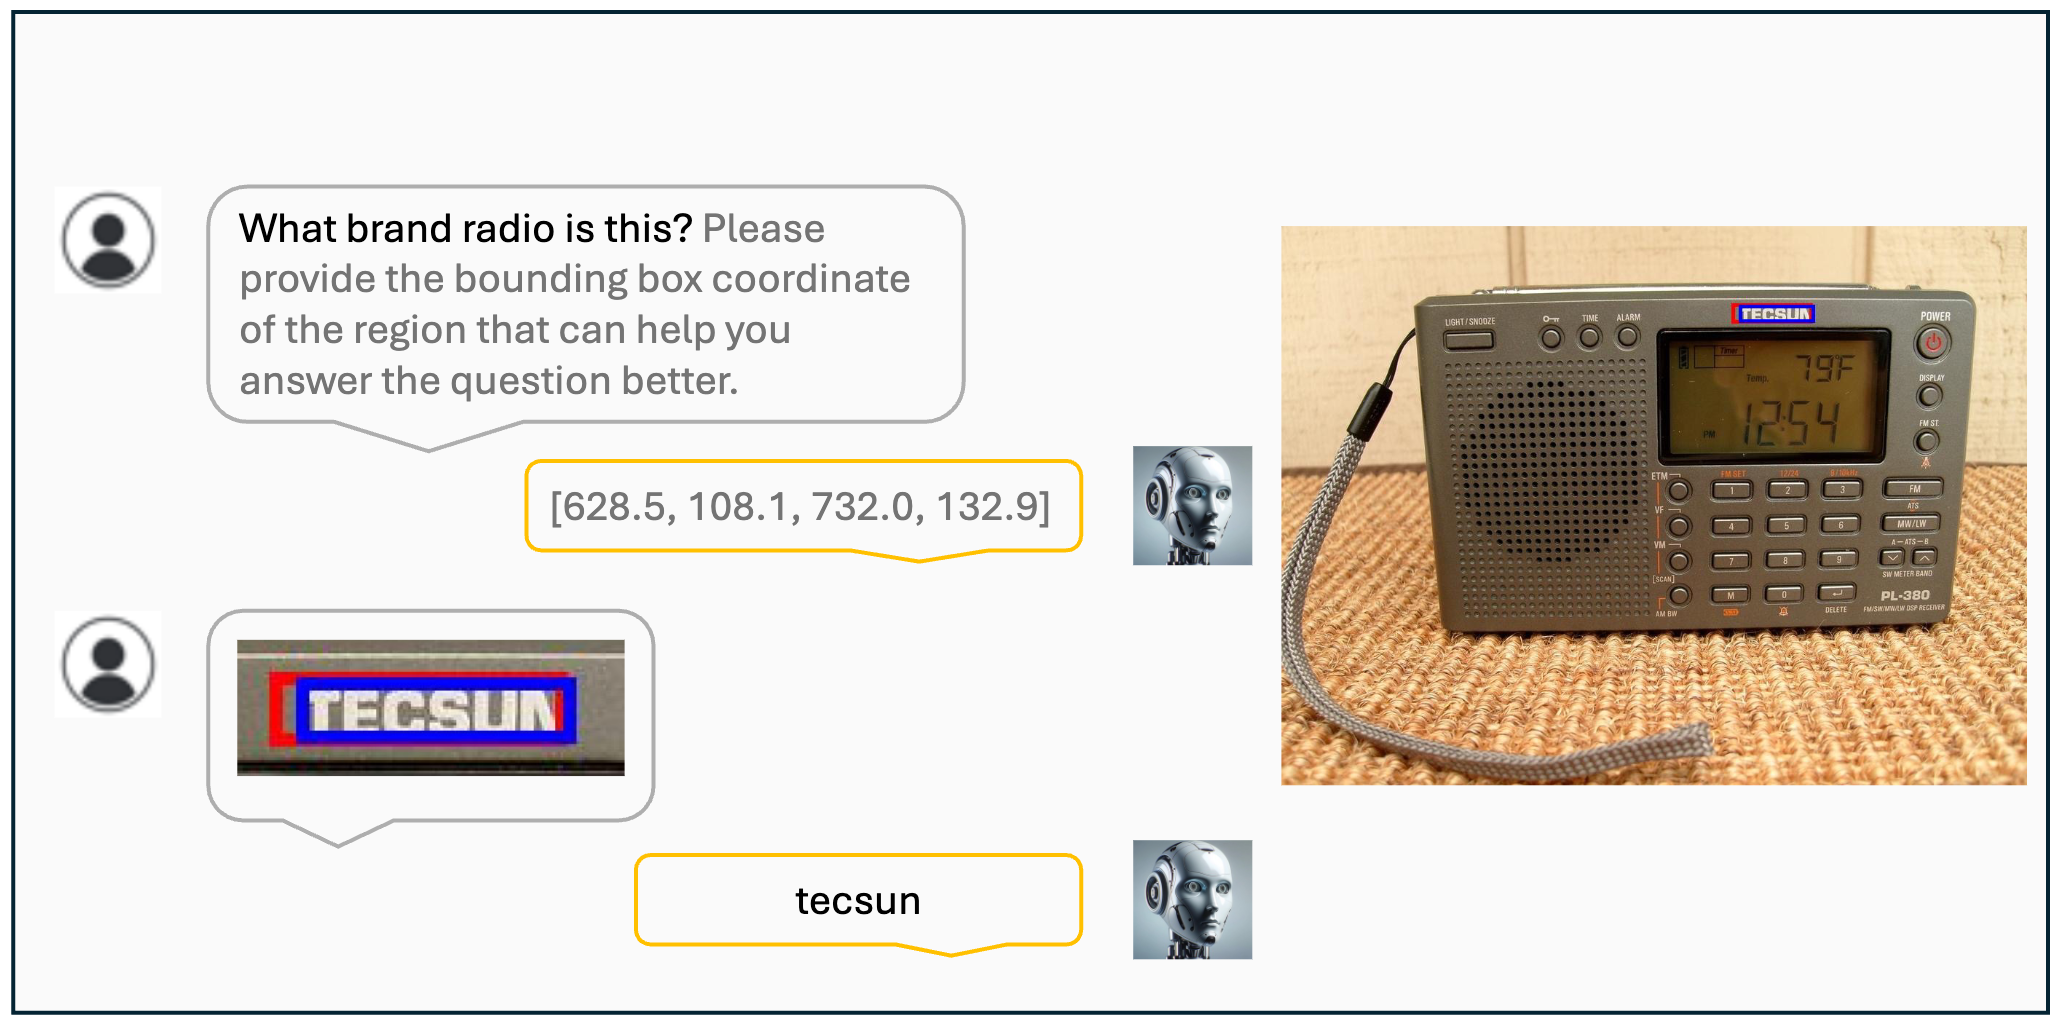
Visualization results of the VisCoT. Model-generated bounding boxes are shown in red, while ground truth (GT) bounding boxes are in blue.
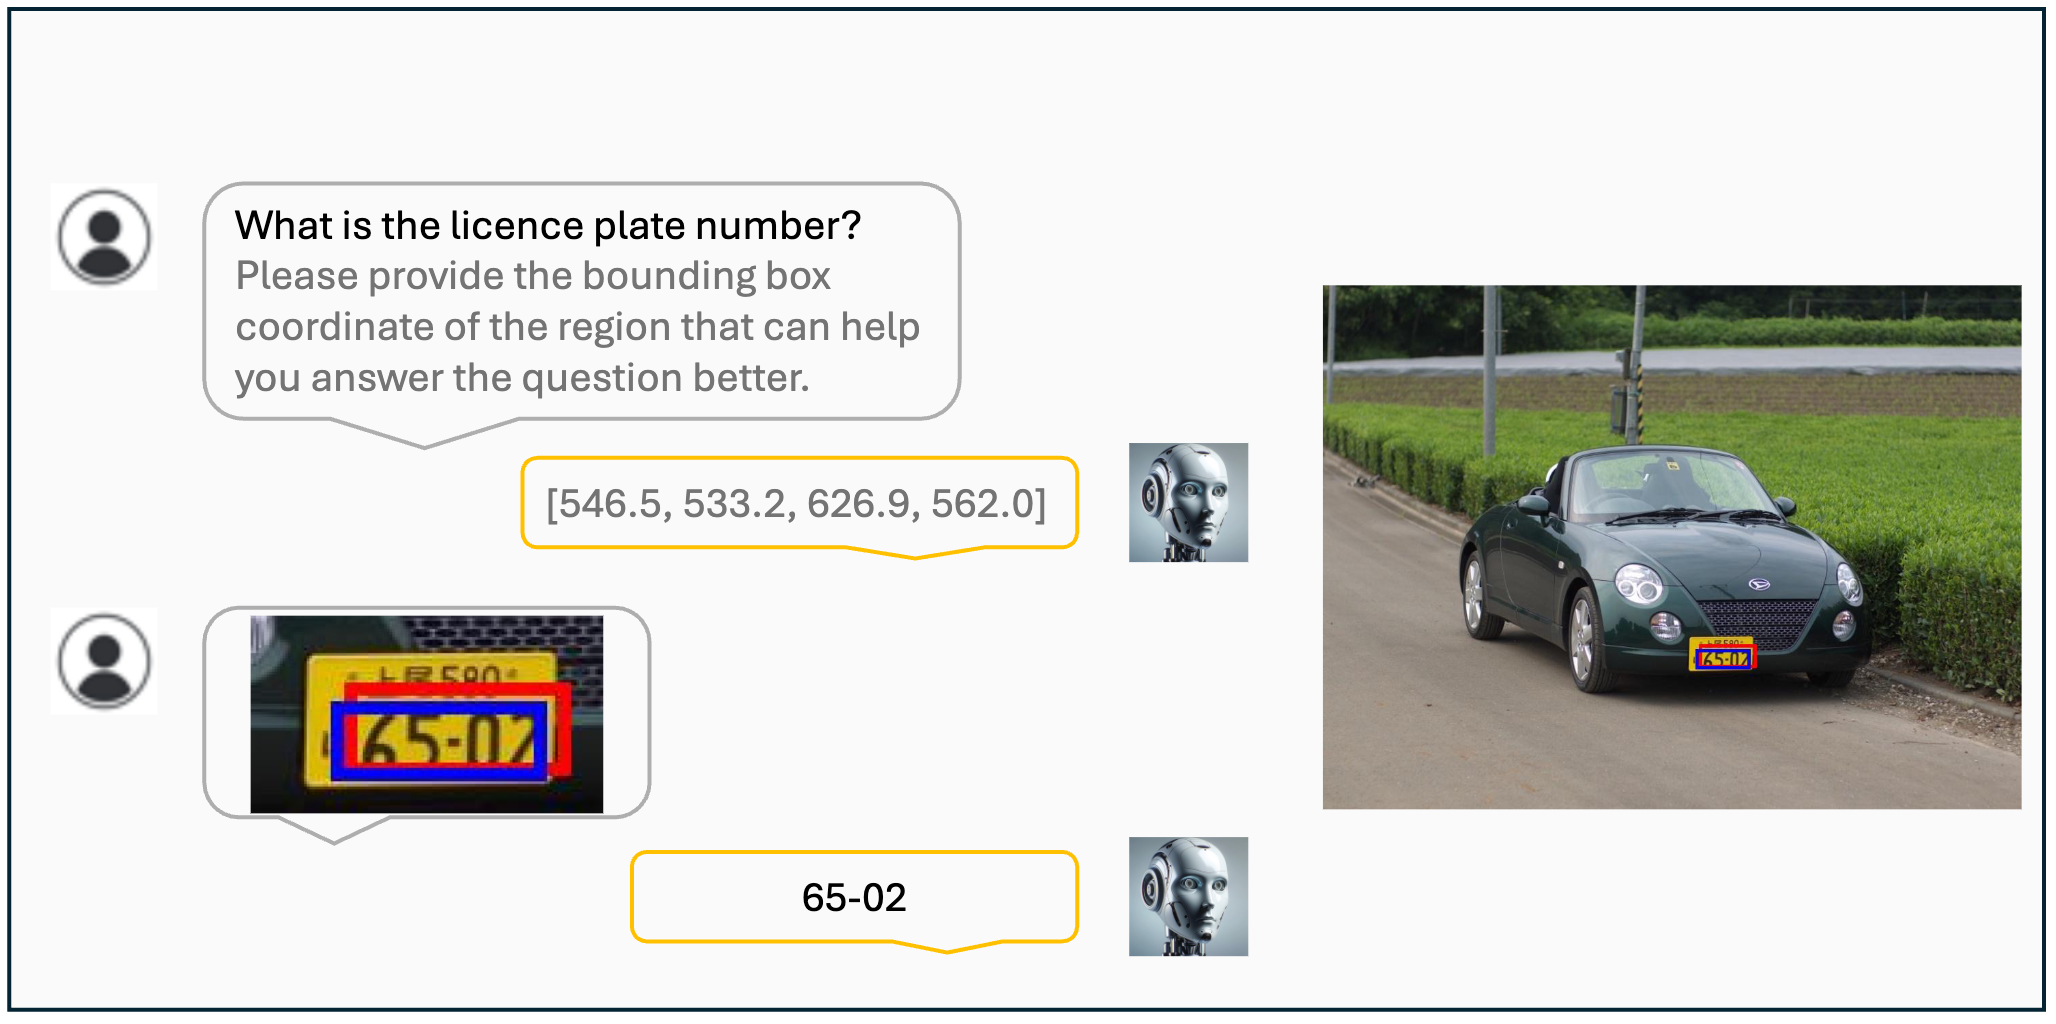
Visualization results of the VisCoT. Model-generated bounding boxes are shown in red, while ground truth (GT) bounding boxes are in blue.
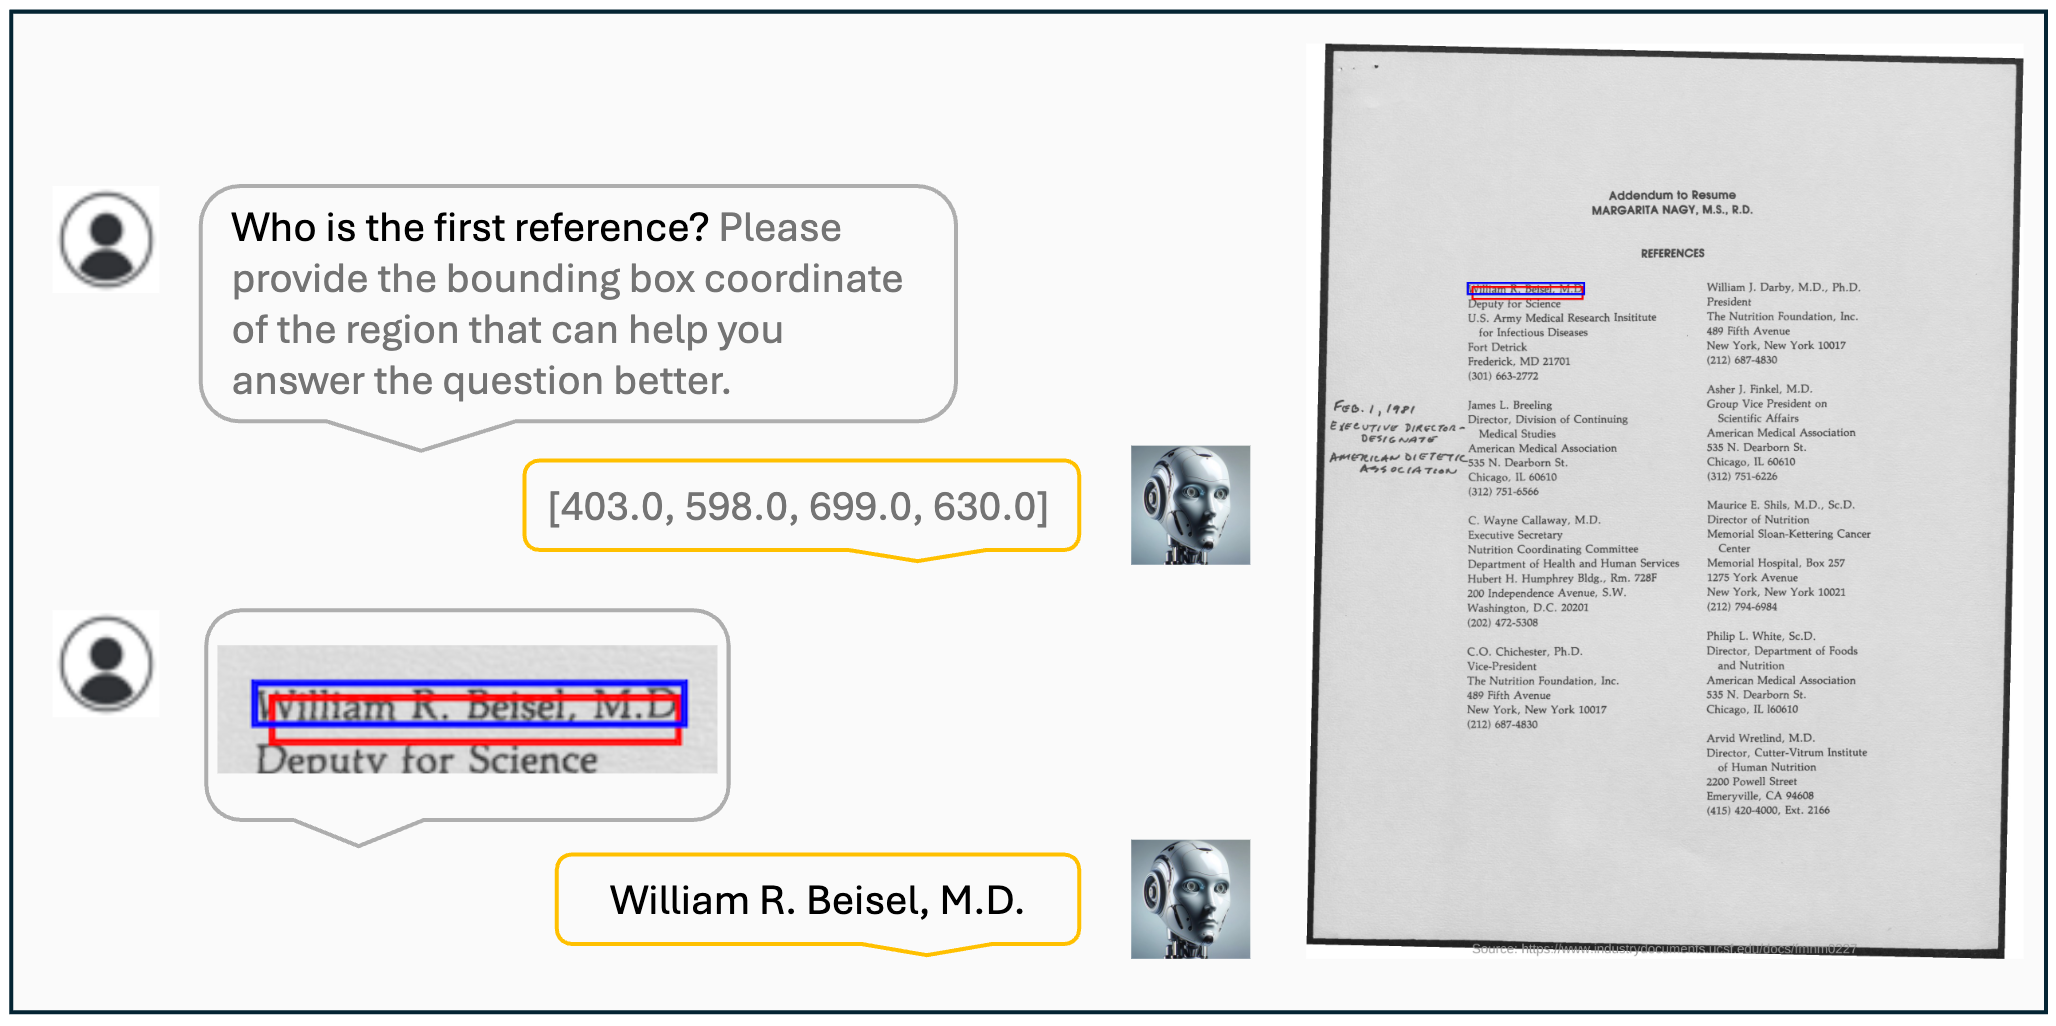
Visualization results of the VisCoT. Model-generated bounding boxes are shown in red, while ground truth (GT) bounding boxes are in blue.
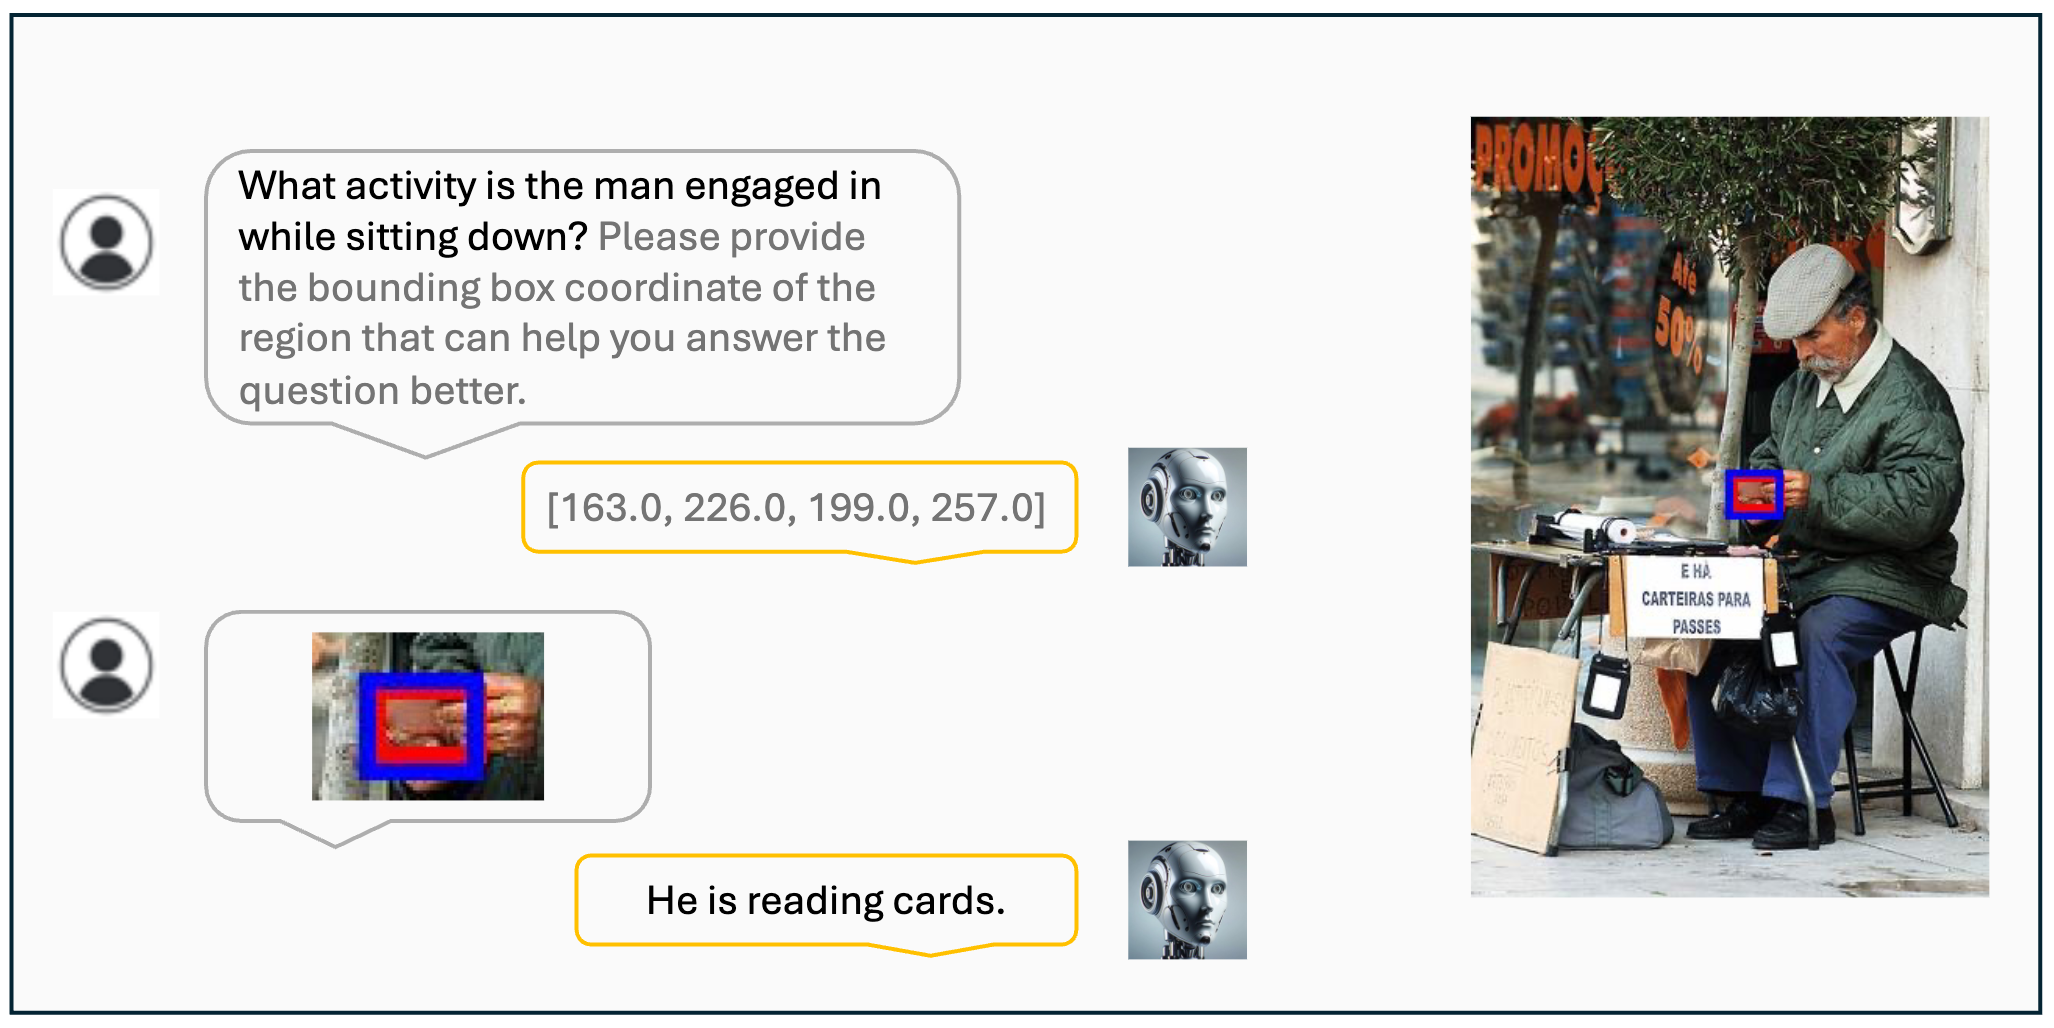
Visualization results of the VisCoT. Model-generated bounding boxes are shown in red, while ground truth (GT) bounding boxes are in blue.
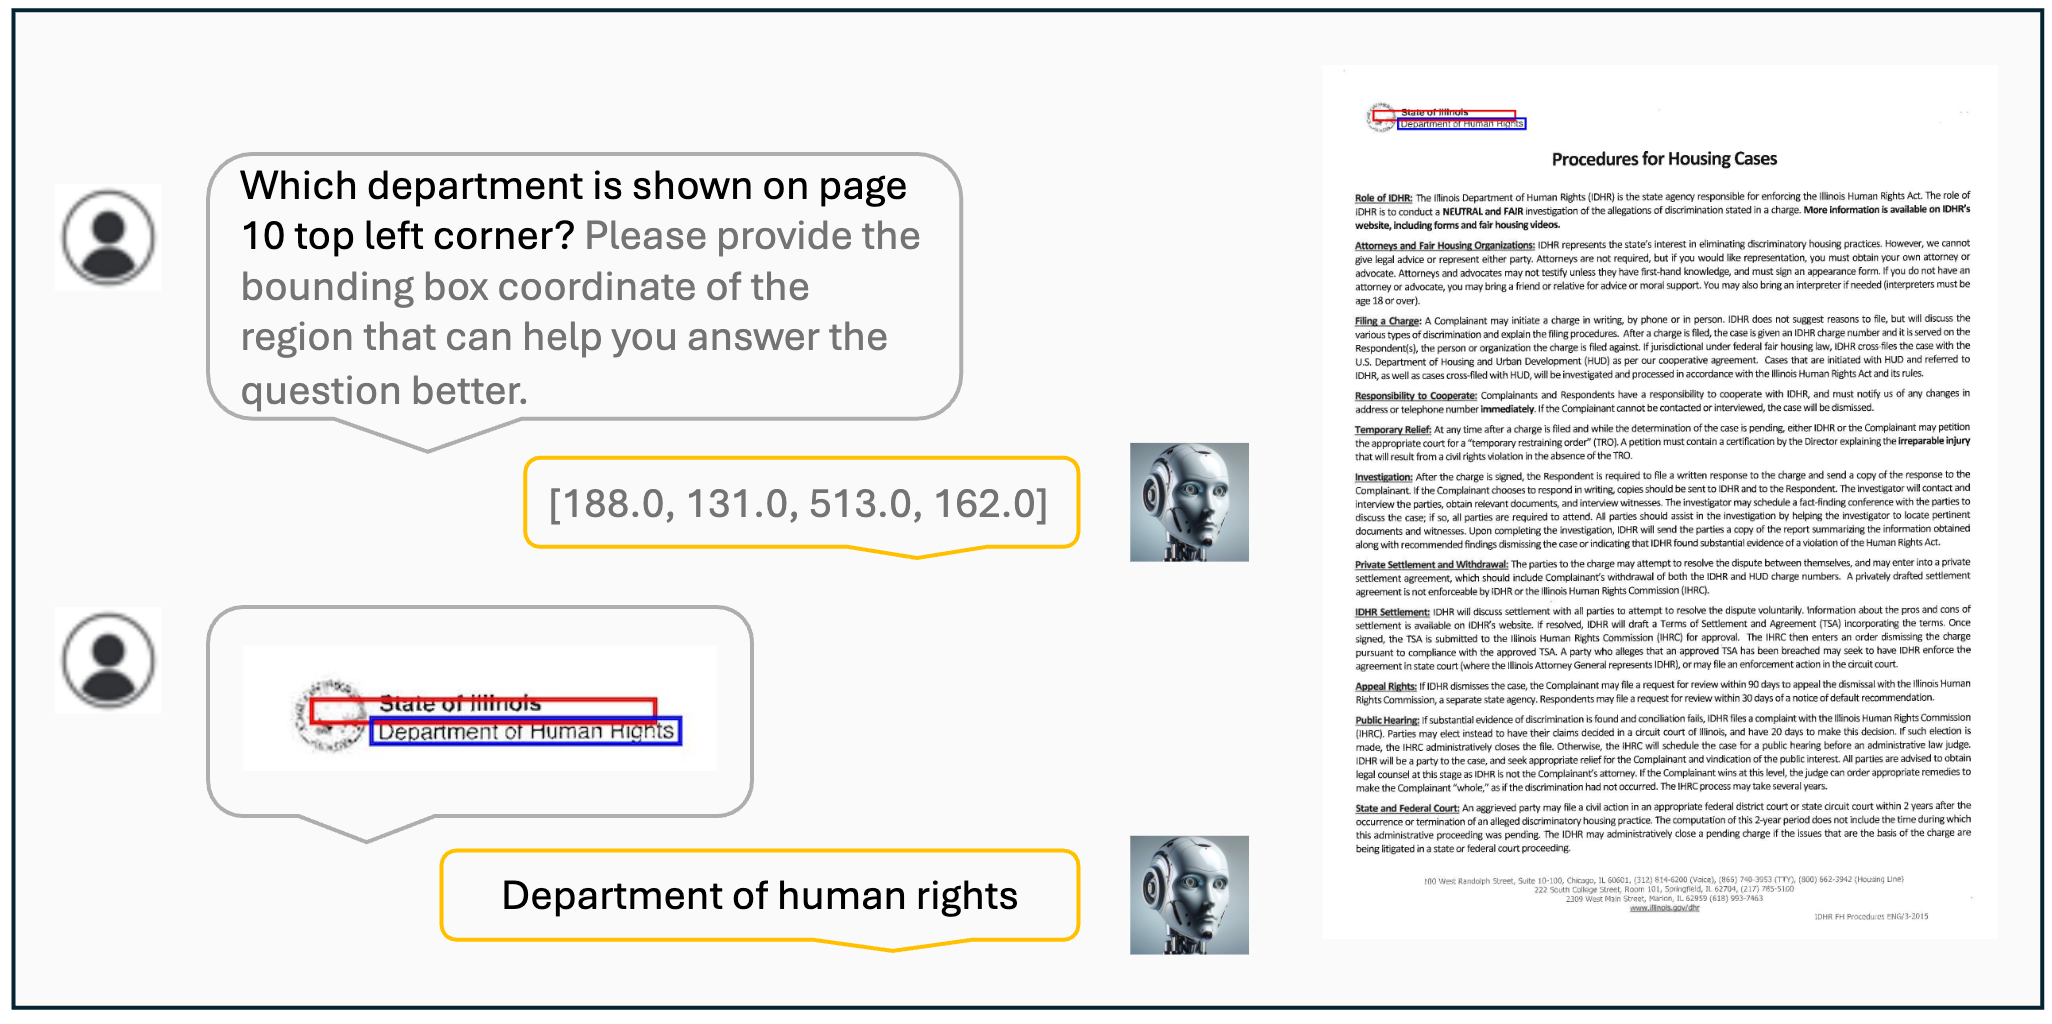
Visualization results of the VisCoT. Model-generated bounding boxes are shown in red, while ground truth (GT) bounding boxes are in blue.

Visualization results of the VisCoT. Model-generated bounding boxes are shown in red, while ground truth (GT) bounding boxes are in blue.
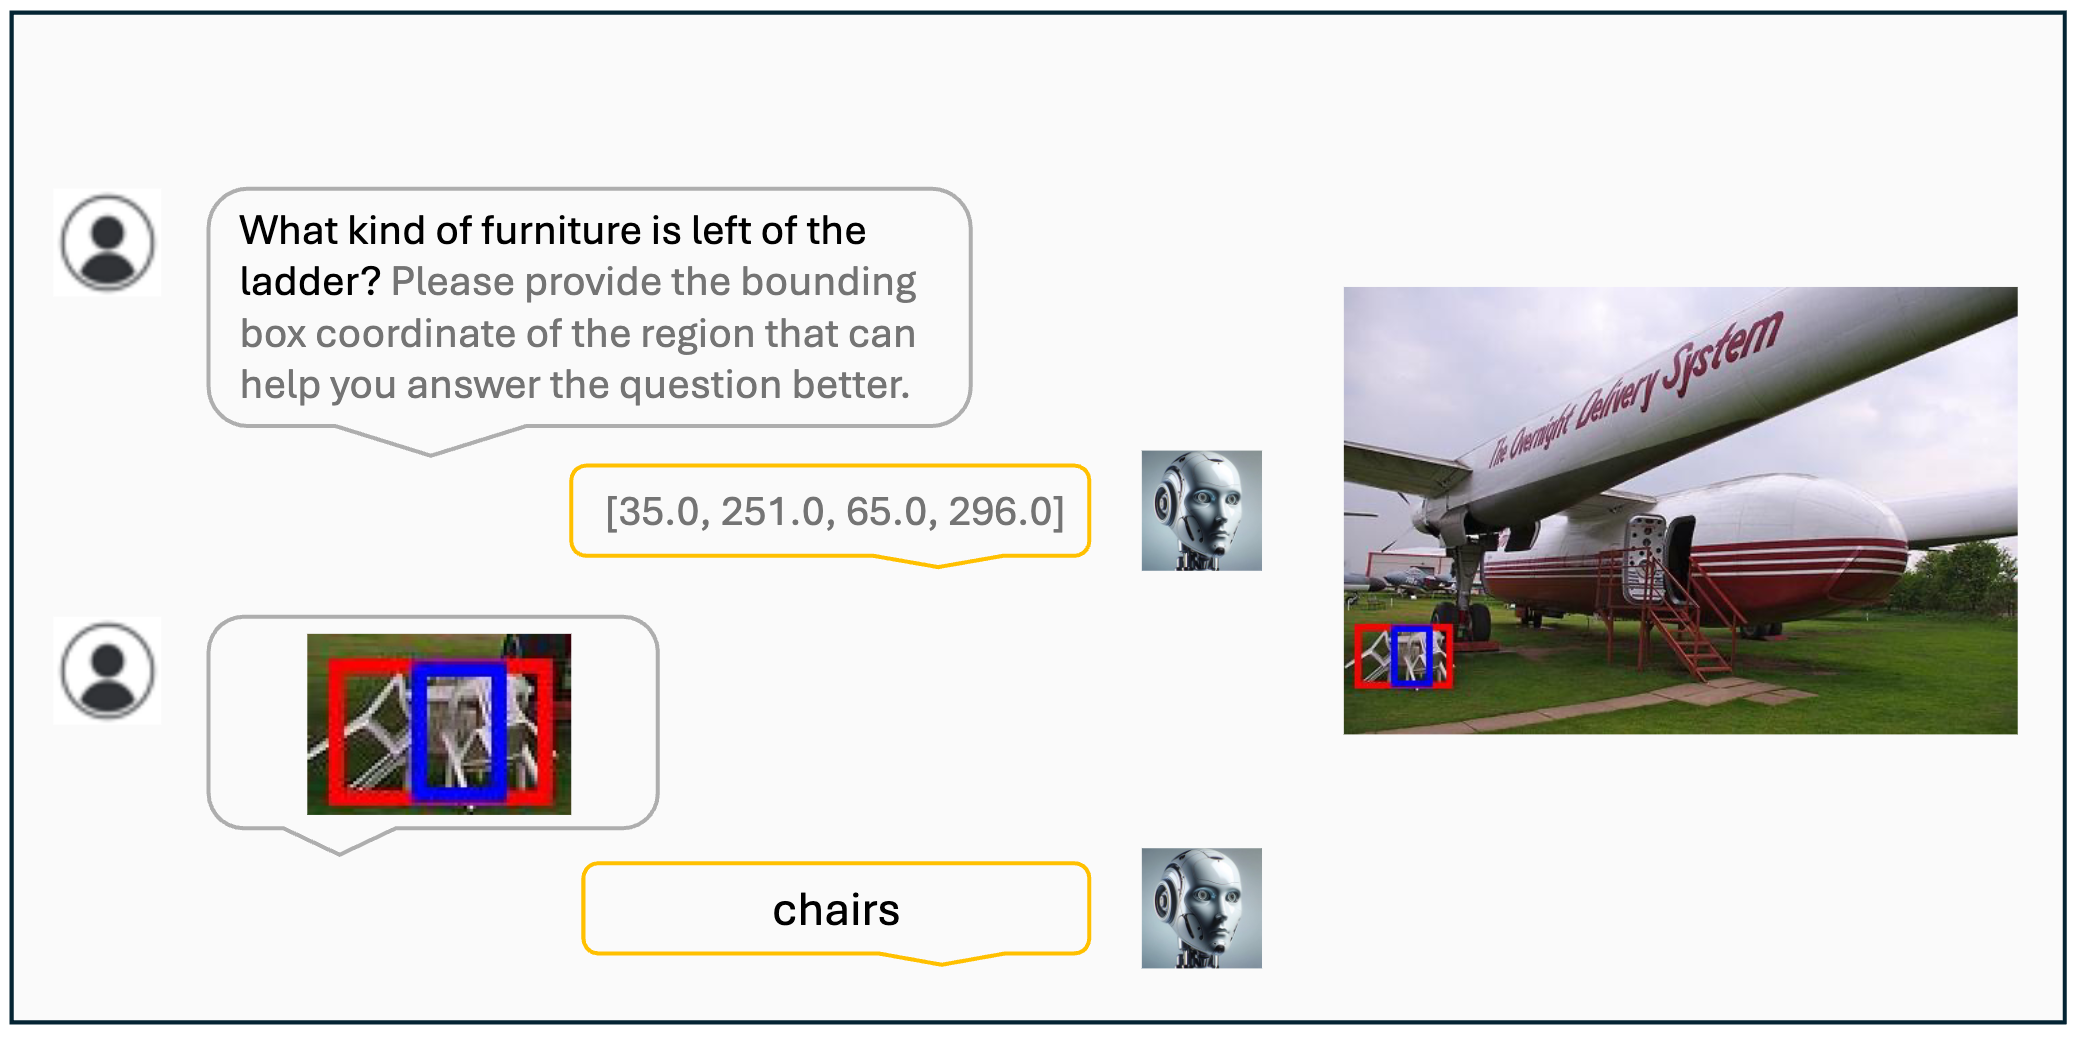
Visualization results of the VisCoT. Model-generated bounding boxes are shown in red, while ground truth (GT) bounding boxes are in blue.
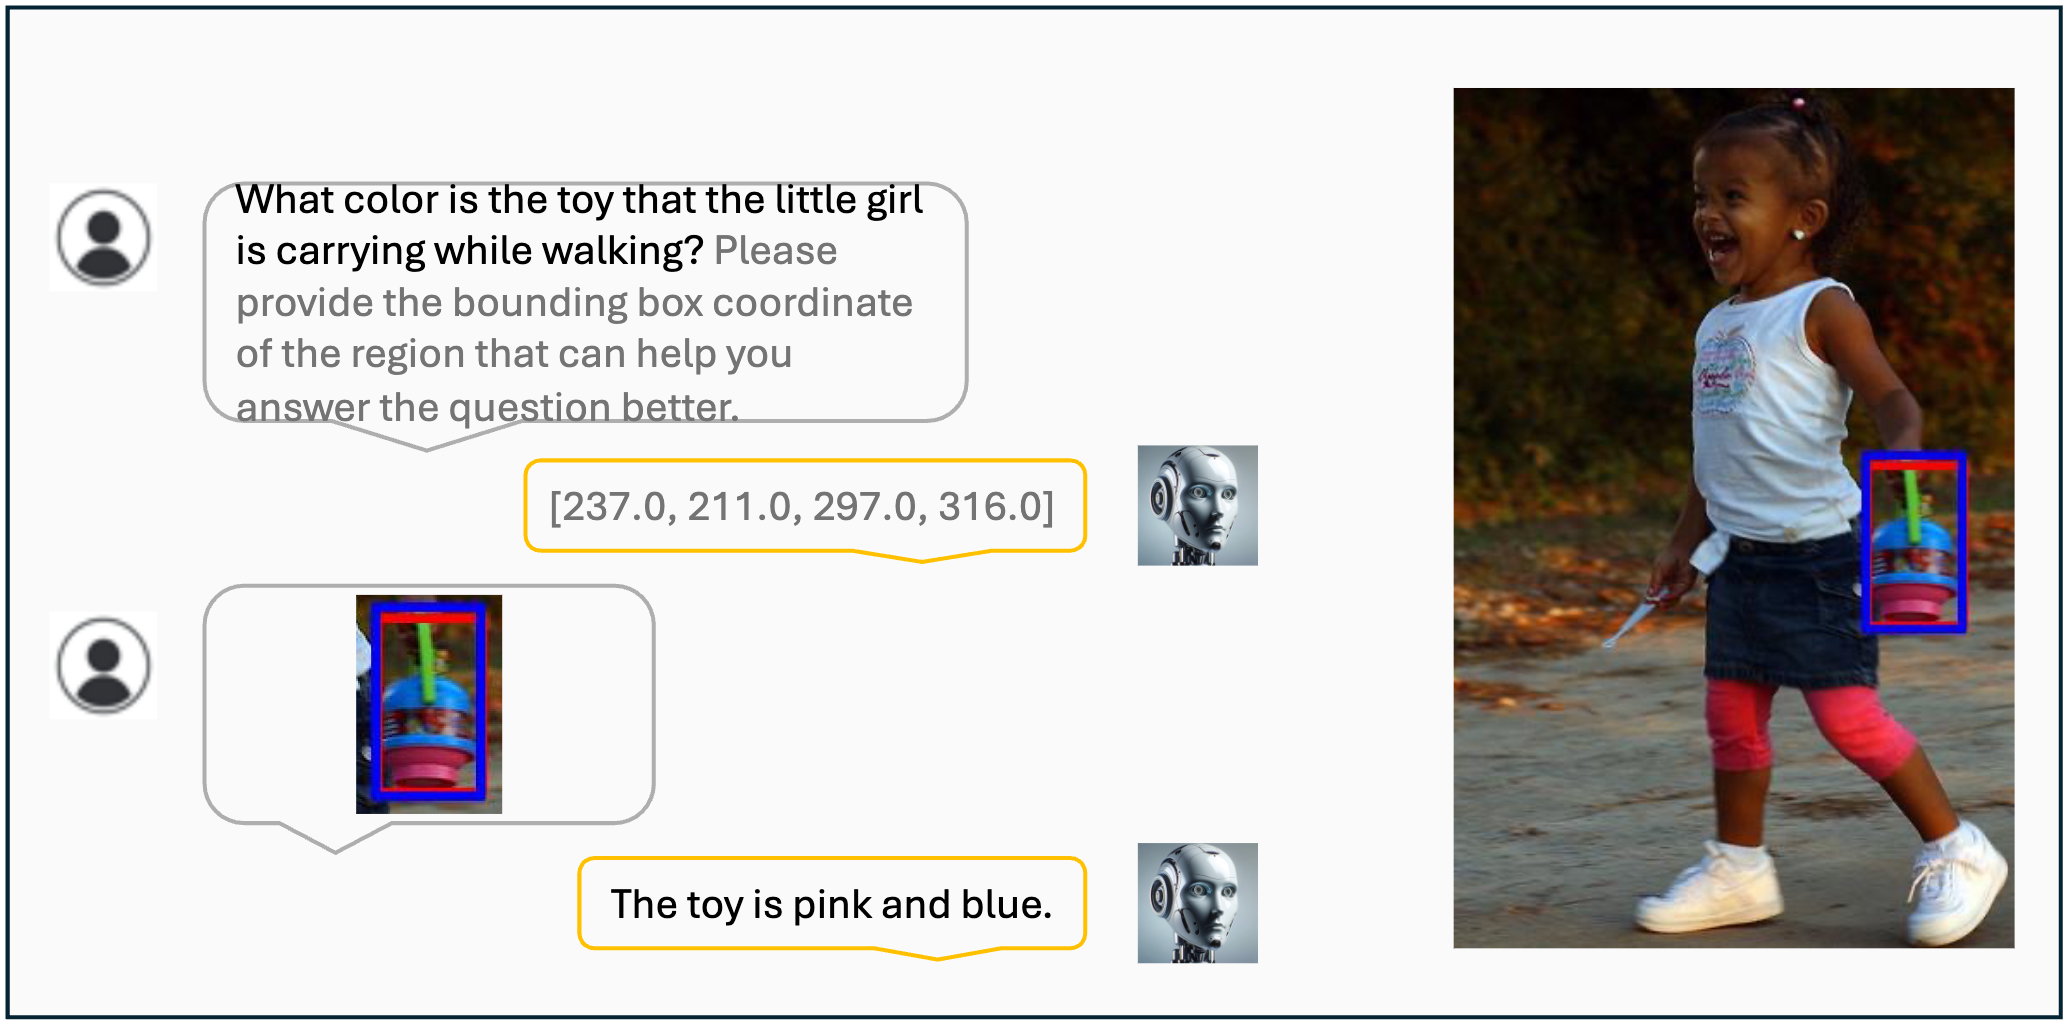
Visualization results of the VisCoT. Model-generated bounding boxes are shown in red, while ground truth (GT) bounding boxes are in blue.
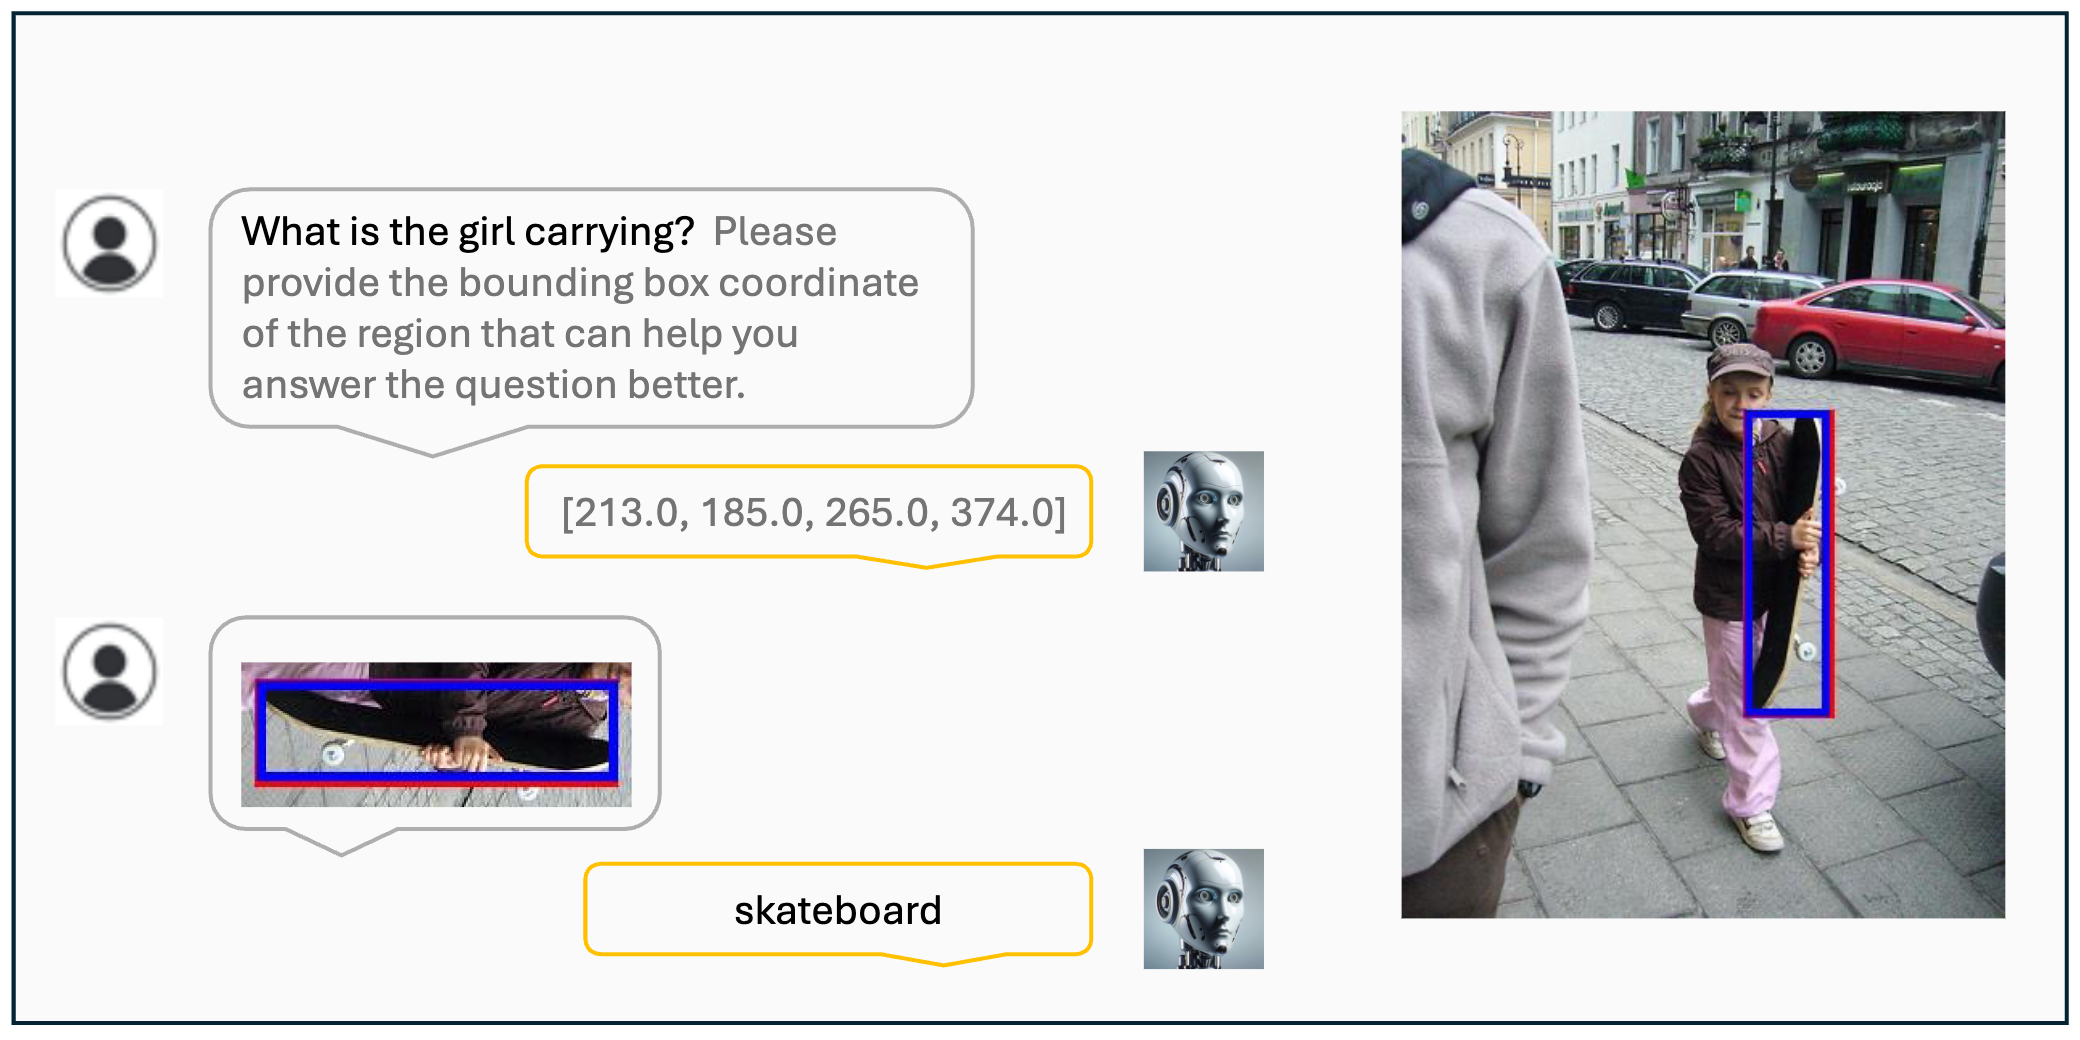
Visualization results of the VisCoT. Model-generated bounding boxes are shown in red, while ground truth (GT) bounding boxes are in blue.
        @article{shao2024visual,
          title={Visual cot: Unleashing chain-of-thought reasoning in multi-modal language models},
          author={Shao, Hao and Qian, Shengju and Xiao, Han and Song, Guanglu and Zong, Zhuofan and Wang, Letian and Liu, Yu and Li, Hongsheng},
          journal={arXiv preprint arXiv:2403.16999},
          year={2024}
        }